Mega-Project - kBLAS (Writing a Benchmark Library in C & Optimizing L1, L2 Basic Linear Algebra Subprograms)
Interactive Graph
Table of Contents
Preface
I love optimizing small handy-dandy C/C++ programs in general and spent quite a bit of time working on optimizing a simple C hash table previously, but that’s about as far as I’ve gotten in this field. This will be my first time trying my hand at optimizing a fairly large Math library. Plus time to use all that stuff I’ve written about HPC thus far (Brent’s Theorem & Task Level Parallelism, Vectorization & Analyzing Loop Dependencies, Parallelism with OMP, Profiling a Program, Theoretical Metrics for Benchmarking, etc.) to some good use. Preliminary Googling tells me there’s quite a few libraries which have implemented BLAS operations to varying levels of success (Blaze, Intel MKL, BLIS, Armadillo, etc.), so it’ll be fun to see just how far I can get against some of these libraries. If time permits I’ll hopefully be able to benchmark my code against them. Note that I’m doing this primarily for educational purposes and I will have an unfair advantage since I have the opportunity to dedicate a lot of time to fine-tuning operations specifically for my test hardware (personal laptop).
Getting Started - Installing BLIS & Tools
Before we can get our hands dirty writing code and profiling programs, I’ll need to have the library setup. I also want to get the damned Intel C/C++ compiler installed. The only issue is I’m currently running Manjaro Linux and Intel does not support this distribution officially, this makes installing Intel oneAPI tools and VTune much harder than it needs to be. Being in college, there’s going to be some days when I’ve got nothing to do and can afford to spend a lot of time working on this project, but today isn’t one of these days.
March 25, 2022 The current goal is to just get the BLIS library up and compiled on my system and also get the Intel C/C++ compiler working by tonight. I want to be able to run a saxpy program which basically just computes $S = \alpha X + Y$ (where $S, X \text{ and } Y$ are vectors and $\alpha$ is a scalar) without any optimizations. Just a simple for loop program compiled and running so I can make sure my setup works.
Installing Intel oneAPI and HPC Tool-kits
Okay, admittedly I’ve gone through this pain before while installing it on my VM, but that doesn’t make it any better. The AUR package intel-compiler-base does not work and asks for some license. I’ll have to install it from Intel’s page, but Intel’s installer does not recognize half the required packages on my system. Hopefully it’ll still work.
Lol. To save anyone else in the same situation, here’s what you’ll want to do. Use the offline installer instead of the online one. And install libcryptx-compat on your system before launching the installer. Then install the oneAPI HPC Toolkit next. Once everything is installed, cd to the installation folder. Default should be /opt/intel/oneapi/. Here you will find setvars.sh. Sourcing setvars will allow you to use the icc command for that shell session. You can add a line in .zshrc to source this file every time you enter a session. source /opt/intel/oneapi/setvars.sh > /dev/null. There’s a noticeable slowdown when I launch a shell session, so will probably find a workaround for this soon.
It looks like I’ve got icc working. I compiled a few files with different flags and everything seems to work as expected.
Installing the BLIS library
Installing and setting up BLIS was relatively easy. It was interesting reading through their build system doc and I’d highly recommend reading their doc on multi-threading as well. I’ve installed BLIS using the zen3 config for my system and multi-threading enabled using openMP. There’s a section on why to use openMP vs pthreads (tl;dr BLIS not providing support for setting thread affinity via pthreads). The entire section on thread affinity is pretty interesting to read though.
A little more effort was required to setup the dev environment I wanted. I recompiled BLIS using --enable-cblas to get CBLAS support and we’ll have to source add /usr/lib/ to LD_LIBRARY_PATH. So add that to ~/.zshrc as well. Then I just setup a simple Makefile and now I can just #include<cblas.h> and things will work as expected. Remember to link -lpthreads as BLIS requires this. And that’s about it, my simple SAXPY program works. I’ve got the cblas and blis libraries setup to benchmark against as well. That’ll be it for tonight. The plan is to get some roof-line analysis done tomorrow and get to know my hardware better so I know what all I have at my disposal and how much performance I can reasonably expect to squeeze out of this machine.
Some other tools
Also installed perf and kcachegrind and gptrace. gprof and valgrind are already installed. However, as mentioned in the doc about profilers, I’m more interested in trying to get stack samples during program execution. I believe gdb and gptrace should help me out here.
Roof-line analysis and inspecting hardware
March 26, 2022 I more or less just plan on getting to know my hardware well so I can try to exploit as many hardware features as I can that I have at my disposal and setup a bench-marking environment. If I make any changes to some program in the name of optimization I want to be able to see the effect it has. Further, I should probably get roof-line analysis done so I know what theoretical peak I can hope to achieve.
Inspecting hardware
I’m not dealing with any specialized hardware here, so consequently there won’t be (much) inspection to do either. Running htop and cat /proc/cpu should provide plenty of information. The official AMD website + wiki-chip should be enough to provide all the spec information. Official AMD Website. Wikichip Website.
Note: Got the memory bandwidth from a third part source (https://nanoreview.net/en/cpu/amd-ryzen-7-5800h)
| CPU Details | |
|---|---|
| CPU | Ryzen 7 5800H |
| Cores | 8 |
| Threads | 16 |
| Base Clock | 3.2GHz |
| Max. Boost Clock | 4.4GHz |
| Memory bandwidth | 69.27 GB/s |
| Cache Details | (64 bit alignment) | |||
|---|---|---|---|---|
| L1 | 512KB | 8-way set associative | - | Per-core |
| L1I | 256KB 8x32KB | 8-way set associative | - | Per-core |
| L1D | 256KB 8x32KB | 8-way set associative | Write-back | Per-core |
| L2 | 4MB 8x512KB | 8-way set associative | Write-back | Per-core |
| L3 | 16MB 1x16MB | 16-way set associative | Write-back | Shared |
| TLB Size | 2560 4K pages | - | - | - |
Supported x86 extensions
MMX Extension, Extended MMX Extension, Streaming SIMD Extensions (SSE), SSE2, …, AVX, AVX2. FMA3, ABM and BMI1, BMI2.
The important ones here are AVX2 and FMA3. We can use intrinsics up to AVX2, which means we have access to $256$ bit vector registers and FMA3 support means we can perform fuse add multiply operations in 1 instruction. There seems to be unofficial support for FMA4 as well according to Agner Fog but it can give incorrect results as well. The only real difference here seems to be that FMA4 allows writing to any free register while FMA3 needs to overwrite an operand register. But this will rarely give FMA4 a lead as FMA3 lets us pick just about any vector register as operand. Hence we should be fine just sticking to the officially supported FMA3 instruction set.
RAM
My RAM is DDR4 and I have 16GB of dual channel memory.
Disk
I have one $1TB$ SSD and the operating system I use (linux) is allocated $512GB$ of disk space.
March 28, 2022 - I wasn’t really able to get much of Saturday’s goals done, so I guess I’ll just be starting from there. Goal is to run some benchmark software to see theoretical GFLOPS/sec vs practical and the same for bandwidth. After that if time permits I’ll try to setup a nice environment for bench-marking C programs.
System Benchmarks
Computing max GFLOPS/sec
Let’s start by computing the theoretical GFLOPS/sec that my machine should be able to achieve. As a refresher, we compute max achievable GFLOPS/sec as
$$ GFLOPS/sec = \text{Number of cores} \times \frac{Clocks}{Cycle} \times \frac{FLOPS}{Cycle} = 8 \times 3.2GHz \times 32 = 819.2GFLOPS/sec $$If we go through the WikiChip page for our architecture, Zen3 is capable of doing $16 \ FLOPS/Cycle$ for double precision numbers and $32 \ FLOPS/Cycle$ for single precision numbers. However, there is also a section about extension instruction sets like FMA which might allow us to get even more GFLOPS/sec.
32 seems to be the peak FLOPS/sec we can hit if we consider allowing all the fancy floating point SIMD vectorzations. However, as mentioned before, theoretical bounds like this are very very inaccurate and do not measure realistic performance. There are several reasons for this, not all FLOPS take 1 cycle, division for example is notoriously slow, SIMD vectorization and of course, the memory wall.
Whetstone benchmark
There’s a bunch of programs out there written to stress-test your machine and record the max insert-quantity-you're-measuring that your machine is capable of. One such tool is the Whetstone Benchmark. I found code for it on Netlib. Although, looking at the code and results it produces, it looks like Netlib’s version measures MIPS, not FLOPS.
As mentioned above, the peak I was MIPS I was able to achieve on my system was $125000$ MIPS. This is however in no way related to FLOPS/sec. MIPS → Millions of (mixed) instructions per second. The benchmark relies heavily on the instruction pool, and results will vary a lot. The Netlib code attempts to provide a decent distribution of all types of instructions but again, this is a very unreliable measure.
March 29, 2022 - I spent most of yesterday looking for benchmarking tools. Turns out there’s very little available resources on the internet for measuring stuff like GFLOPS/sec because apart from CPU vendors, practically everyone considers it to be a bad benchmark. Nevertheless, I came across phoronix-test-suite which is a pretty cool tool… when it works. Most of the tests I tried to run had dependency or build issues and debugging each one was painful. However, some of the recommended ones did work. The stream benchmark gave pretty poor results, so I decided to run it locally and figure out what’s wrong. I’ll probably spend most of today benchmarking bandwidth and GFLOPS/sec and see what’s the best I can do.
Stream - Memory bandwidth benchmark
These were the highest scores I was able to hit for each individual test while varying several compiler flags and pragmas. To achieve these results I modified the code to set the maximum number of threads OpenMP spawns to 4 (from the default 16). Why? I’m not sure, but I’m guessing on O3 the vectorized instructions generated are insanely fast and the overhead from creating threads ends up slowing it down. 4 threads seems to be the sweet-spot for gaining performance. For add and triad we got around 37GB/s each using 4 threads. But a single thread was able to crunch through FMA 2GB/s faster.
Update (March 31, 2022) - I was wrong about this. Running the benchmark on two threads proved to be the fastest scores we can get across the board. I believe the reason for this is the fact that I have only dual channel memory and memory can only reach my CPU across two channels. If I have more than 2 threads trying to pull in memory they’re probably going to end up competing for cache and channel bandwidth and hence slowdown performance overall. Updated table as well.
| Operation | Highest MB/s | Compiler | Compiler Flags |
|---|---|---|---|
| Copy (a[i] = b[i]) | 39685.0 | icc | -O3 -xCORE-AVX2 -qopenmp |
| Scale (a[i] = scalar*b[i]) | 39513.6 | icc | -O3 -xCORE-AVX2 -qopenmp |
| Add (a[i] = b[i]+c[i])) | 40520.8 | icc | -O3 -xCORE-AVX2 |
| Triad (a[i] = b[i]+scalar*c[i])) | 40706.4 | icc | -O3 -xCORE-AVX2 |
Concluding, I can say the 5800H on my machine has a bandwidth of around $\approx \ 40GB/sec$ according to the stream benchmark.
Mystical / Flops
From the README file of that project,
Modern x86 and x64 processors can theoretically reach a performance on the order of 10s - 100s of GFLOPs. However, this can only be achieved through the use of SIMD and very careful programming. Therefore very few (even numerical) programs can achieve even a small fraction of the theoretical compute power of a modern processor. This project shows how to achieve >95% of that theoretical performance on some of the current processors of 2010 - 2014.
The theoretical peak we computed was $819.2 \ GFLOPS/sec$, let’s see how much of that theoretical bound this benchmark can hit.
Single-thread performance
128-bit AVX+FMA
| Datatype | Operations | GFLOPS |
|---|---|---|
| Single-Precision | Add / Sub | 30.784 |
| Double-Precision | Add / Sub | 15.408 |
| Single-Precision | Multiply | 34.752 |
| Double-Precision | Multiply | 17.376 |
| Single-Precision | Multiply + Add | 46.8 |
| Double-Precision | Multiply + Add | 23.424 |
| Single-Precision | FMA | 65.856 |
| Double-Precision | FMA | 33.024 |
256-bit AVX+FMA
| Datatype | Operations | GFLOPS |
|---|---|---|
| Single-Precision | Add / Sub | 61.632 |
| Double-Precision | Add / Sub | 30.752 |
| Single-Precision | Multiply | 69.408 |
| Double-Precision | Multiply | 34.656 |
| Single-Precision | Multiply + Add | 92.64 |
| Double-Precision | Multiply + Add | 45.792 |
| Single-Precision | FMA | 131.136 |
| Double-Precision | FMA | 65.664 |
Our theoretical peak performance per thread that we computed was $\frac{819.2}{8} = 102.4 \ GFLOPS/sec$.
Most of the numbers on this sheet seem to correspond to performance under that metric and we see almost an exact $2\times$ increase in performance when we move from 128-bit AVX to 256-bit AVX which is exactly what we’d expect to see. However, notice that Single-Precision 256-bit FMA has recorded 131.136 GFLOPS/sec, which is almost 30 GFLOPS higher than we computed. Normally we’d expect to see practical numbers lower than computed.
Inspecting further, I noticed that the single core that the benchmark ran on turbo-boosted to and maintained a clock-speed of $4.2GHz$ throughout the benchmark. Further, as the WikiChip page for flops mentions clearly,
For example, a typical fused multiply-accumulate (FMAC) operation can perform two floating-point operations at once. For a single core, this can be expressed as $FLOPS_{core} = \frac{instructions}{cycle} \times \frac{operations}{instruction} \times \frac{FLOPs}{operation} \times \frac{cycles}{second}$
Computing this value is hard without knowing the exact architecture level specifics of our processor. But even ignoring this and using the updated clock-speed of our processor, we get a theoretical bound of $4.2 \times 32 = 134.4 \ GFLOPS/sec$ which is in line with our benchmark results.
Multi-thread performance (8 cores/16-threads)
128-bit AVX+FMA
| Datatype | Operations | GFLOPS |
|---|---|---|
| Single-Precision | Add / Sub | 252.576 |
| Double-Precision | Add / Sub | 123.776 |
| Single-Precision | Multiply | 243.792 |
| Double-Precision | Multiply | 120.912 |
| Single-Precision | Multiply + Add | 420.96 |
| Double-Precision | Multiply + Add | 217.344 |
| Single-Precision | FMA | 473.664 |
| Double-Precision | FMA | 236.832 |
256-bit AVX+FMA
| Datatype | Operations | GFLOPS |
|---|---|---|
| Single-Precision | Add / Sub | 470.976 |
| Double-Precision | Add / Sub | 232.224 |
| Single-Precision | Multiply | 450.048 |
| Double-Precision | Multiply | 223.968 |
| Single-Precision | Multiply + Add | 787.968 |
| Double-Precision | Multiply + Add | 394.608 |
| Single-Precision | FMA | 883.392 |
| Double-Precision | FMA | 439.296 |
This time there isn’t an (almost) exact $8\times$ increase in performance but the numbers are very close to it. The small discrepancies we see can mostly be accredited to overheads in creating more threads and memory sharing over multiple cores. Similarly, we can again see Single-Precision 256-bit FMA beat the estimated theoretical peak. Monitoring CPU utilization again, most of my cores were running at 3.5GHz instead and 2 were running at 3.8GHz.
Accounting for this, we get a theoretical bound of $915.2 \ GFLOPS/sec$ which is again, in line with our benchmark results. Although this isn’t an accurate bound when dealing with FMA instructions.
Writing my own benchmarks
March 30, 2022 One common pattern I noticed in both benchmarking programs is the use of AVX2 and omp to parallelize the load over all 16 threads. If I want to post scores similar to or even better than the programs I found on GitHub utilizing AVX2 efficiently is critical. For parallelizing it over multiple threads I’m still not sure what the best course of action is. There are multiple libraries such as OpenMP and pthreads which provide an API to allow parallelization over multiple threads. OpenMP seems to be the most optimized, easy-to-use and portable among the 2 options, allowing me to parallelize for loops using just a single pragma #pragma omp parallel for. However, if time permits, I think I’ll try out both libraries and see how each of them perform. Otherwise, I’ll just stick to OpenMP.
A few things to keep in mind:
- The computation must take in some pre-defined input (if I want to check accuracy) or must include non-determinism or there’s high chances the compiler just optimizes the computation to compile time.
- The computation must do something with the result, maybe print output or something so that the compiler doesn’t just skip all the computation.
I’ll have to be careful about this or risk inaccurate benchmarks.
Writing a benchmark library
This is also a good opportunity to write a basic benchmarking library. It’ll be very useful to have a re-usable and trust-able benchmarking library to rely on when optimizing BLIS.
March 31, 2022 - I spent most of my time yesterday and today working on and testing the benchmark library. There were many ways to write the library and it gave weird results that I wasn’t sure were right until confirmed with another benchmarking library (Written in C++). Plus it’s also very easy to make it run parallel tests over multiple threads. As of now it works on OpenMP but if I have time I’ll consider adding a pthreads implementation as well. The code for the library can be found here:
Tuning the Stream benchmark
April 4, 2022 I’m planning on writing the memory benchmarks today.
The Stream benchmark utility provides really nice functionality to write custom tuned benchmarks which are run instead of the normal stream benchmarks when compiled with -DTUNED. This means I won’t need to use the benchmarking library or write fancy printing code. I can simply work on the tuned code and let the benchmarking tool run it. Now coming to writing tuned code, I prefer to do the vectorization manually. Going through the load/store instructions on Intel’s intrinsics page, there are both streaming and non-streaming instructions available both of which perform at the same Latency/Throughput measures. The primary difference between streaming vs non-streaming instructions is that the non-streaming versions evict present data in cache to store the newly loaded values. In all the operations, I never care about a previously loaded value after initial load. So I’m thinking streaming instructions will help here. Also, quoting a comment from Stack Overflow:
Based on last comment from an old topic on that matter: software.intel.com/en-us/forums/intel-isa-extensions/topic/… Assuming CPU optimizes such a read at all the data is loaded into a cache line-size buffer, which is separate from the data cache. There is not many of these buffers available so best when the content of the buffer is read in subsequent instructions otherwise it might be lost and needed to be reacquired with potentially big performance penalty. And the copying itself will not be faster than with cached memory - but will not evict entire working set from cache.
If this is true, then it shouldn’t affect me pre-fetching the next addresses as well. Further, since I have 16 vector registers available and independent load / stores happening I’ll attempt to unroll the loops as well.
Update: Yes, streaming the writes back instead of storing gave a $2 \times$ increase in bandwidth.
Results
GCC / Clang without -DTUNED
Function    Best Rate MB/s  Avg time     Min time     Max time
Copy:           36853.5     0.035270     0.034732     0.038729
Scale:          21994.3     0.059661     0.058197     0.065483
Add:            26976.9     0.072385     0.071172     0.076895
Triad:          26512.4     0.073506     0.072419     0.076874
GCC / Clang with -DTUNED
Function    Best Rate MB/s  Avg time     Min time     Max time
Copy:           41040.2     0.031695     0.031189     0.034857
Scale:          41048.0     0.031470     0.031183     0.032065
Add:            40111.3     0.048329     0.047867     0.049275
Triad:          40077.0     0.048333     0.047908     0.049962
We see massive improvements (more than 19 GB/s in Scale for example!). We also hit our highest recorded bandwidths of 41GB/s. -DTUNED simply tells the benchmark to run the custom tuned code I wrote instead of the default code. The Intel compiler benchmarks aren’t as interesting as it was already hitting $\approx39-40GB/s$ but it did boost by roughly $\approx +1GB/s$.
ICC without
-DTUNEDFunction Best Rate MB/s Avg time Min time Max time Copy: 39773.8 0.032854 0.032182 0.034661 Scale: 39858.0 0.032708 0.032114 0.035328 Add: 40366.6 0.047950 0.047564 0.050785 Triad: 40395.6 0.047940 0.047530 0.048804ICC with
-DTUNEDFunction Best Rate MB/s Avg time Min time Max time Copy: 41038.6 0.031655 0.031190 0.033246 Scale: 41009.7 0.031747 0.031212 0.033515 Add: 40725.3 0.047596 0.047145 0.049452 Triad: 40672.7 0.047437 0.047206 0.048021
These were the exact flags passed to each compiler:
- GCC -
-O3 -ffast-math -mavx2 -fopenmp -DSTREAM_ARRAY_SIZE=80000000 -DNTIMES=20 -march=znver3 - Clang
-O3 -ffast-math -mavx2 -fopenmp -DSTREAM_ARRAY_SIZE=80000000 -DNTIMES=20 -march=znver3 - ICC -
-O3 -xCORE-AVX2 -qopenmp -g -ffreestanding -DSTREAM_ARRAY_SIZE=80000000 -DNTIMES=20
Note: Two modifications were made to the original stream benchmark code. The first modification was limiting the number of OpenMP threads created to just 2. The second was using __attribute__((aligned(32))) to align all the arrays to 32-bit boundaries. This alignment was in place for the runs without -DTUNED as well.
My code for the tuned version of the stream benchmark can be found here:
kBLIS/benchmarks/stream/stream.c
The main optimizations done were using AVX2 and FMA instructions, loop unrolling and using stream write instead of just write.
Writing mGBPS
While Stream is a decent memory bandwidth benchmark, I’m not sure if it’s the absolute max bandwidth I can squeeze out of my system. Wikipedia defines memory bandwidth as,
Memory bandwidth is the rate at which data can be read from or stored into a semiconductor memory by a processor
All of Stream’s benchmarks involve more complicated operations such as say, copying or adds etc. which require multiple load/store operations which are dependent on each other. The primary issue with such an operation is that the corresponding store operations cannot be performed until the load operation is done. This dependency has potential to slow down certain writes.
April 5, 2022 My goal is to get the absolute maximum possible bandwidth that I can out of my system by removing the dependency in my read/write operations. The idea is to design something like this:
- Have two arrays, one means for reading and one meant for reading.
- In each iteration half the registers are dedicated to reading an summing values in array
Aand the other half are writing some constant value to arrayB. Perhaps I can use just 1 read value to write toBto not waste any registers on storing constants. - Experiment with the stream and non-stream versions of instructions.
Previously, I got nearly 1.5x - 2x speedups by using the stream instructions. Only int supports 256-bit stream reads, so I’ll use the integer datatype.
Update: Sadly the compiler optimizes out any independent reads in the for loop as I’m not really doing anything with the read values. Hack-y tricks like using functions with O0 enforced pragmas and inling don’t work either. I’ll have to inline asm the code.
April 6, 2022 This talk by Chandler Carruth is one of the best talks I’ve seen on benchmarking. He described a couple of neat tricks that work on any compiler that supports the GCC syntax for inserting inline asm. The simple asm we write allows us to insert “empty” instructions into the assembly which essentially trick the compiler into thinking there is artificial use for variables / code which renders it’s dead code elimination (DCE) pass ineffective. Using this, I was able to record bandwidth up-to $\approx 45 GB/s$ with both GCC and ICC.
------------------------------------------------------------
Single-thread:	Benchmark information - Independent R/W
------------------------------------------------------------
Total runtime:			5.000988
Result computed:		0.000000
Total FLOPS computed:		0
Total memory accesses:		227520000000

GFLOPS:				0.000000
Bandwidth:			45.495008 GB/s
One caveat with this approach, the values read from memory also get written to stack memory once. This is a consequence of the fact that I must reference the address of each read 256-bit value to escape it. This would count as a second write operation but because this write is to the exact same location millions of times, it’s all writes to locations that are loaded into cache. Hence my bandwidth readings of $80+GB/s$ rely heavily on cache and is the “effective” bandwidth, not actual bandwidth. So I’d guess my actual bandwidth is slightly higher than $45GB/s$. I’ll update the code eventually with inline assembly which does not have this same issue. The code for this benchmark can be found here:
Writing mGFLOPS
April 7, 2022 First thing, if there’s any chance of reaching close to the computed theoretical peak, I cannot let memory bandwidth bottleneck my program. This means I cannot read any data from memory during the entire computation. We’ll have to initialize registers to some constant/input data and keep performing computations using only this initial data. Since we’re just using registers here we’ll just talk about SIMD ADD’s of registers A and B as A+B without regard for the packed ADD.
We have exactly 16 256-bit registers free in x86-64 architectures. Any more and I’ll have to spill over some register values to memory. So if I want to max FLOPS I’ll want to use all 16 registers and no more than 16 registers. As for which instruction to pick, we are mainly dealing with throughput here. Ideally we’ll want to pick instructions with low latency and low CPI (high throughput). But in conflicting cases we’ll probably be better off with prioritizing lower CPI. This immediately rules out almost all categories except the Arithmetic category of avx2 instructions
As for load/store ops, ideally we’d want to eliminate them as well. They have latency 1 and 0.5CPI but they don’t count as floating point operations and using them usually means interfacing with memory, which we want to avoid at all costs. FMA has the highest chance of maximizing throughput thanks to the fused multiply and add it performs so we should also be trying to fully utilize just FMA instructions.
_mm256_fmadd_pshas throughput 0.5 CPI and latency 4 which is about the same as a simpler_mm256_add_psinstructions but gets two instructions done instead of just one.If we’re using FMA we’re computing an expression of the type $DST = A \times B + C$. To have some meaningful computation, I think I’ll fix registers $A$ and $C$ to be constants and keep $14$ accumulative registers. $A, C$ and $B[0] \dots B[13]$ will be the input for the program.
Setting up the benchmark environment for BLIS
Pretty much an entire week and some more went into the creation of a neat benchmark environment for this.
The benchmark library
First up, the benchmark library that I wrote was specifically tailored for running Kernels that followed a specific function signature. I can’t make BLIS, CBLAS or KBLAS conform to that signature. I don’t think C provides a way to typecast function pointers to an arbitrary type and recast them easily, although I’m sure its possible. Even if we went this route each function has specific arguments and we end up with a lot of conditional checks for creating arguments to pass to these functions either ways. If this was C++, we had more opportunities thanks to templates which would allow me to offload this work to the compiler. Since we don’t have that luxury, the next best way to imitate this behavior in C is with well… #define. This is a terribly hack-y way of doing this, but it works and lets me keep my code look somewhat “clean”. I essentially made parts of the function a set of macros so I can write my benchmark like so:
 * Usage:
 * BENCH_START(FRUN, MRUN, DUR, NAME)
 *     reset_vars(...)
 *     START_RECORD
 *         fun(arg1, arg2. ...)
 *     END_RECORD
 * BENCH_END
Notice the section where I allow myself to call some function reset_vars. A hurdle I came across while benchmarking is that the BLAS prototypes all modify the vector given to them as input. Repeatedly calling the function in a loop, for example in scal just makes the elements go to $+inf$ and that’s not ideal. Floating point computations near the extremities ($+inf/-inf$ or $\approx0$) is not representative of true performance. This means I’ll need a section of code to reset my vector and this must not be timed. Hence we make this inclusion here to allow for such reset operations.
mem_flush
Another thing we’ll be needing is mem_flush. This function is how Intel recommends we flush the cache. This function becomes relevant when we’re dealing with small memory vectors/matrices where the effects of cache heavily influence the benchmark. It’s very important that the benchmarks are fair and all 3 library implementations are provided as similar environments are possible.
fill_cache
In contrast to mem_flush, this function does the opposite. It performs a series of sequential reads and populates the cache with cache-lines from whatever memory was passed to it. I realized that fill_cache pretty much ends up flushing most unnecessary stuff from cache thanks to cache eviction policies and works pretty well even without mem_flush. However, especially for large vectors this might end up being a very slow operation and I don’t want the benchmark to take much time. Hence we relied on the same tools used to write the mGBPS benchmark. Using the escape trick to turn off compiler optimizations and 256 bit unrolled AVX loads gives us a really fast fill_cache function.
Relevant code can be found here
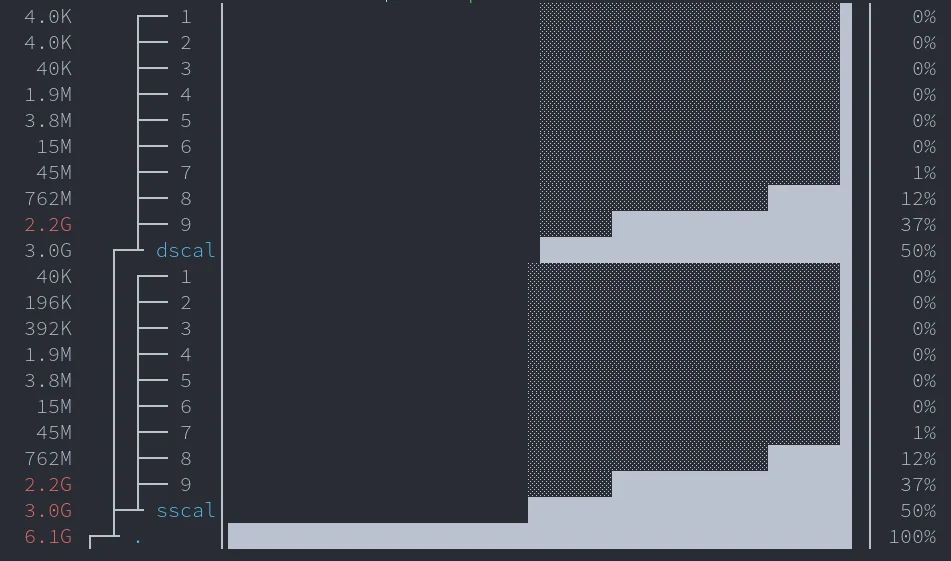
Now that this is done, we still need a way to check if our functions return CORRECT results. When making optimizations its really easy to get carried away and chase higher numbers and forget about verification. I also want to benchmark across different data-sizes. To do this, I decided to setup the following workflow. The idea is that the benchmark program must be placed in a top level directory which looks like this
├── benchmark_program
├── generator_program
├── input
│   ├── dscal
│   │   ├── 1
│   │   ├── ...
│   │   └── 7
│   └── sscal
│       ├── 1
│       ├── ...
│       └── 9
└── verification
    ├── dscal
    │   ├── 1
    │   ├── ...
    │   └── 7
    └── sscal
        ├── 1
        ├── ...
        └── 9
A generator program generates files with some input in the input/ directory and then also outputs files in the verification/ directory with the CORRECT output for that input.
The generator program
File generation is a standalone program, so I decided to allow myself to use C++ here. With templates in C++, life is a lot easier and with minimal code we have a neat little program which outputs binary files in a specific format that can be read by a C program. All I have to do is modify the config map whenever required and it’ll generate the files for me. Further, a minor modification in the cmake file allows me to generate this directory structure.
The code for the generator program can be found here:
kBLIS/benchmarks/generator/gen.cpp
C++ provides us with nice tools to generate random numbers which follow some probability distribution. I’m using std::mt19937 gen which is a mersenne twister engine that I will seed with std::random_device. This engine will give us high quality random numbers and we can combine this with std::uniform_real_distribution<T> to get random real numbers in some interval. I chose $1 - 10^6$ as the default range.
As mentioned in the comments, this is the expected target for the config files. I believe this will cover enough data range to get a good idea of how our modification affect program results.
 /**
	 * The goal here is to benchmark the functions for varying sizes in memory. Ultimately
	 * memory will end up becoming the benchmark for large vector / matrix operations.
	 * Here is a reasonable guide to picking config sizes:
	 * + 1-3 options should fit in L1-L2 cache
	 * + 4-6 options should fit in L2-L3 cache
	 * + 7-9 options should overflow cache and start occupying large amounts of system memory
	 *
	 * Tip: For the double versions of benchmarks, simply half the memory usage of the float versions
	 */
For verification, I rely on the fact that the results provided by CBLAS are accurate. These are the results I will test my KBLAS implementations against.
The benchmark
The benchmark itself is a bit involved. All the files are pretty much duplicates of each other (we are back in C land :() with special argument parsing for each type of function and function call. We can go over one such file, say sscal_bench.c here.
The first part of the code simply parses argument using
getopt. Settingminandmaxlimits is useful when I just want quick results for some memory size or when running usingvalgrindor other slow profiling tools.Each file is read one by one and the size of the files are displayed. The config I’ve given for the generator program generates files in ascending order of memory usage and we can see how increasing data size of our vectors affects the FLOPS/sec and bandwidth accordingly as more and more cache misses occur.
The files all contain binary data in this format
[int] dim N, [int] dim M, [float/double] N*M matrix. The functions in out benchmark libraryget_fargandget_dargget one argument and move the file pointer to the next argument if any. This lets us quickly get arguments and populate the right variables. We then make copies of some vectors so we can quickly reset arguments later on.For resetting variables, we call two lines of code.
memcpy(X, xcpy, N * sizeof(float)); fill_cache((const char*) X, N * sizeof(float));memcpyresets the vector, but pulls both the copy andXinto cache which compete for cache. We fill the entire cache withXnext to ejectxcpyand let our working set be in cache.After this is just the call to the function being benchmarked. Only this call is in the timed region. This is looped till the function execution time crosses a minimum threshold of $2$ seconds. Then results are outputted.
The order of benchmarks being run is $CBLAS \to KBLAS \to BLIS$ (per file).
The following is an example of the file sizes generated for the scal benchmarks:
To make sure the benchmark actually works and is benchmarking what we actually want it to benchmark, I ran the program with perf, (perf record -g ./<program_name>). This generates a perf.data file which can be used to visualize all the information I want to visualize about the program. perf report -g 'graph,0.5,caller'.
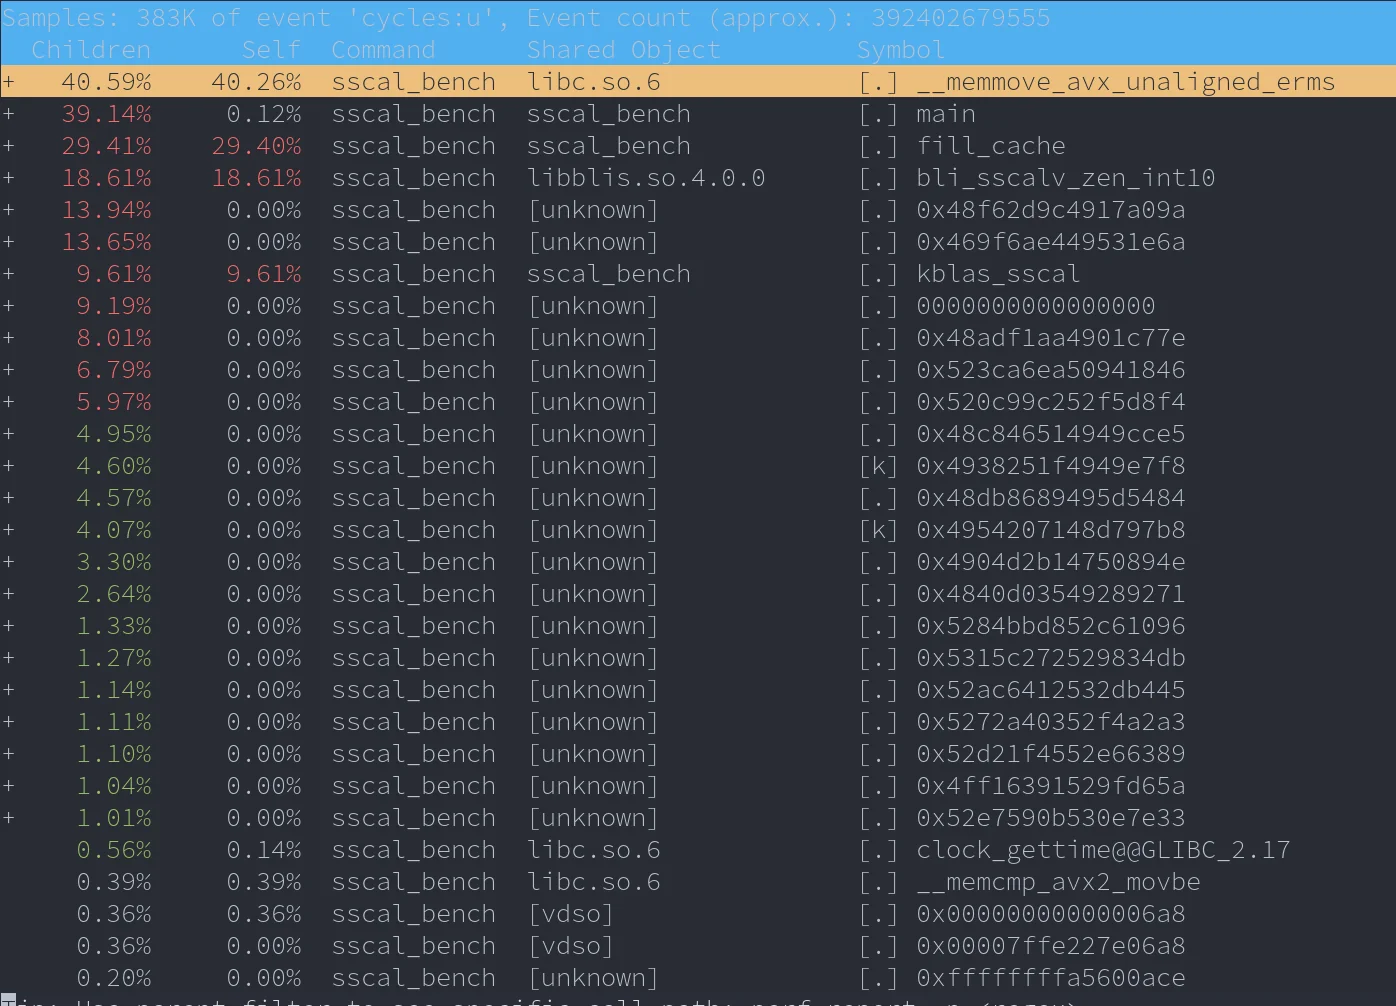
Time spent executing code in main (not a child function) is $\approx0.12\%$ which is pretty good. Most of the time is sadly spent in the memcpy function which has to be called to reset the arguments passed to #scal. I can’t think of a better way except this, for smaller data sizes the function being benchmarked runs relatively fast and hence is called many times to get an accurate reading. The same is the case for fill_cache. It is often executed when we know the contents of X are not fully in cache and hence it takes the brunt of the cache misses and has slow execution time. These functions are not included in the timed region so it shouldn’t affect benchmark results.
Finally, bli_sscalv_zen_int10 in libblis.so.4.0.0 takes about $\approx18\%$ execution time while kblas takes around $\approx 9\%$. The time in the libblis shared object contains both the time spent running the cblas function call and the blis function call. A simple way to verify this is run perf on the benchmark while omitting out one of the calls to either CBLAS or BLIS, this gives us
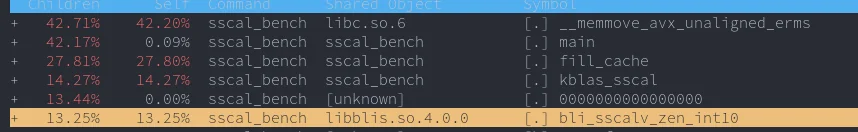
We now see a much more even distribution. Opening the call graph on the first perf report gives a few weird symbols but it does seem to indicate a split between two calls each taking $\approx9\%$ execution time.
Note: Lesser $\%$ of execution time on the perf report does NOT mean it was faster. Because of the dynamic nature of the benchmark, faster functions might get called more times and hence the program might spend more time executing the faster functions. What we expect to see is the dynamic nature of the benchmark keeping the execution times approximately equal between the functions and that is exactly what we see. Hence I’m fairly sure the benchmark does exactly what we expect it to do.
Final addition, I also voluntarily broke the kblas code to return incorrect results to ensure that the verify functions work and can confirm that it did pass that test at the very least.
The relevant benchmarking code can be found here:
As we keep running the benchmark for an iterative feedback → improvement process it becomes important to quickly get results for specific memory sizes. So I just added an option to pass in flags like --min=6KB or --max=64MB to run the benchmark only on files that are within this memory capacity. This allows for quicker feedback.
Starting with KBLAS optimizations
BLAS Level 1
sscal & dscal
These are probably the simplest functions to implement in the entire library. Given a vector $X$ and a scalar $\alpha$, it performs the following calculation: $X = \alpha \cdot X$. A basic implementation of the function would probably look like this. We can augment this with pragmas but that is about all we can do with pragmas.
for (int i = 0; i < N; i++) {
		X[i * incX] *= alpha;
}
The function signature of the scal set of functions looks like this: void #blas_#scal(const int N, const float alpha, float *X, const int incX). I’m particularly interested in a specialization of this function where $incX = 1$. When this is true, we know that the elements that we are accessing are all exactly $1$ stride away from each other. That is, they are contiguous and I can make full use of SIMD here. When working with large data, a single branch if doesn’t matter much. So we forward this function to a specialized void kblas_sscal_inc1(const int N, const float alpha, float *X) when $incX = 1$. In the specialized function, we do standard loop unrolling and SIMD intrinsics to get maximum performance.
Observations and design space search:
A simple SIMD implementation of the above function along with $12\times$ loop unrolling to facilitate register renaming does pretty well and is mostly on par with the CBLAS / BLIS implementations. Even without using
#pragma omp simd, inspecting the instructions generated with evenO3shows us that the compiler pretty much tries to do the same. But perhaps with lesser use of all $16$ SIMD registers.The next step is to parallelize over cores. Here we face the first major hurdle. False sharing. Quoting Wikipedia,
When a system participant attempts to periodically access data that is not being altered by another party, but that data shares a cache block with data that is being altered, the caching protocol may force the first participant to reload the whole cache block despite a lack of logical necessity. The caching system is unaware of activity within this block and forces the first participant to bear the caching system overhead required by true shared access of a resource.
Essentially, if we have all 16 threads trying to access data what we have is a data access pattern where each thread pre-fetches some cache lines into memory. If these cache-lines are requested by another thread, they now have to bear the cost of shifting the data across caches. This is especially prevalent behavior in non-coherent L1/L2 caches. This leads to what is known as thrashing, and the cache misses deal huge slowdowns. Hence a simple
#pragma omp parallel forwill not do.Design space search. OpenMP provides a lot of interesting modifiers we can add to the pragmas to get more find grained control of the multi-thread allocation. Thread affinity means a lot in these scenarios. Adding
proc_bind(spread)instructs OpenMP to pick allocations such that the threads are as far away apart from each other as possible. Similarlycloseimplies they are as close as possible. This includes two hyper threads operating from the same core. Using 2 threads gives interesting results.
KBLAS - sscal
+----+---------------+------------+
|    |   Memory used |   GFLOPS/s |
|----+---------------+------------|
|  0 |       15.6439 |   14.8958  |
|  1 |       16.6439 |   24.3836  |
|  2 |       18.2288 |   16.0736  |
|  3 |       19.2288 |   10.3453  |
|  4 |       20.2288 |   21.1504  |
|  5 |       21      |   33.0208  |
|  6 |       22.3219 |   32.2854  |
|  7 |       23      |   23.0411  |
|  8 |       23.585  |    7.6065  |
|  9 |       24      |    6.10622 |
| 10 |       24.3219 |    5.61181 |
| 11 |       25      |    5.15223 |
| 12 |       26      |    4.20697 |
| 13 |       27      |    3.59869 |
| 14 |       28      |    3.57481 |
| 15 |       29      |    3.86786 |
| 16 |       30      |    3.75847 |
+----+---------------+------------+
CBLAS - sscal
+----+---------------+------------+
|    |   Memory used |   GFLOPS/s |
|----+---------------+------------|
|  0 |       15.6439 |   25.8997  |
|  1 |       16.6439 |   26.482   |
|  2 |       18.2288 |   22.9104  |
|  3 |       19.2288 |   22.6618  |
|  4 |       20.2288 |   19.3967  |
|  5 |       21      |   19.5086  |
|  6 |       22.3219 |   18.2897  |
|  7 |       23      |   13.9195  |
|  8 |       23.585  |   10.1656  |
|  9 |       24      |    4.18144 |
| 10 |       24.3219 |    3.99074 |
| 11 |       25      |    3.87764 |
| 12 |       26      |    3.87251 |
| 13 |       27      |    3.83174 |
| 14 |       28      |    3.67364 |
| 15 |       29      |    3.73085 |
| 16 |       30      |    3.68187 |
+----+---------------+------------+
BLIS - sscal
+----+---------------+------------+
|    |   Memory used |   GFLOPS/s |
|----+---------------+------------|
|  0 |       15.6439 |   22.2387  |
|  1 |       16.6439 |   24.5427  |
|  2 |       18.2288 |   20.8703  |
|  3 |       19.2288 |   21.7485  |
|  4 |       20.2288 |   18.7602  |
|  5 |       21      |   20.1412  |
|  6 |       22.3219 |   17.9279  |
|  7 |       23      |   13.5539  |
|  8 |       23.585  |    9.65506 |
|  9 |       24      |    4.12919 |
| 10 |       24.3219 |    3.98638 |
| 11 |       25      |    3.88883 |
| 12 |       26      |    3.86826 |
| 13 |       27      |    3.83379 |
| 14 |       28      |    3.71239 |
| 15 |       29      |    3.71288 |
| 16 |       30      |    3.54376 |
+----+---------------+------------+
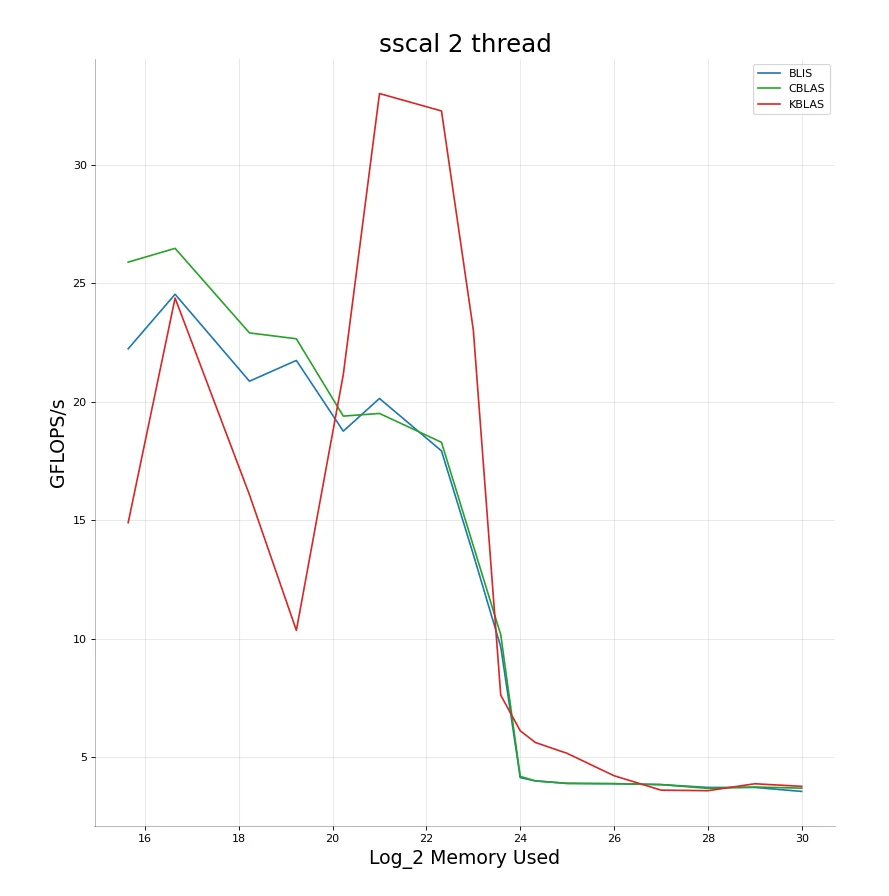
- The benchmarking workflow I use iteratively increases the size of the files it runs the benchmark on. The first observation we see from using 2 threads is that performance has horribly degraded for small data $(\leq 1MB)$.
- However, after the $1MB$ mark, performance is sky high. Then we again see degradation near $64MB$. There’s a big drop near $16MB$. This is exactly the point where we run out of cache memory and have to go all the way to main memory. This drop is expected and there is nothing much that we can do.
Optimizing this
Why is it that below $\approx1MB$ using multiple threads has horrible performance?
→ The answer is fairly simple. $L1/L2$ cache are really fast and any data accesses made here are simply so fast that the entire operation finishes really quickly. This means that the overhead that comes from thread initialization and division of cache greatly outweigh how much a single core can crunch through. If it can be supplied data fast enough it can compute fast enough.
- This leads us to our first optimization, I disable multi-threading until we reach a certain point of memory usage. This point clearly comes only after we overflow the $L2$ cache of the core. Each of my cores have $512KB$ cache. For me the tipping point is somewhere around $2 \times L2 \ cap$. Capping threads at $2$ is fine but not ideal.
Can we somehow boost the thread count higher without facing the consequences of false sharing?
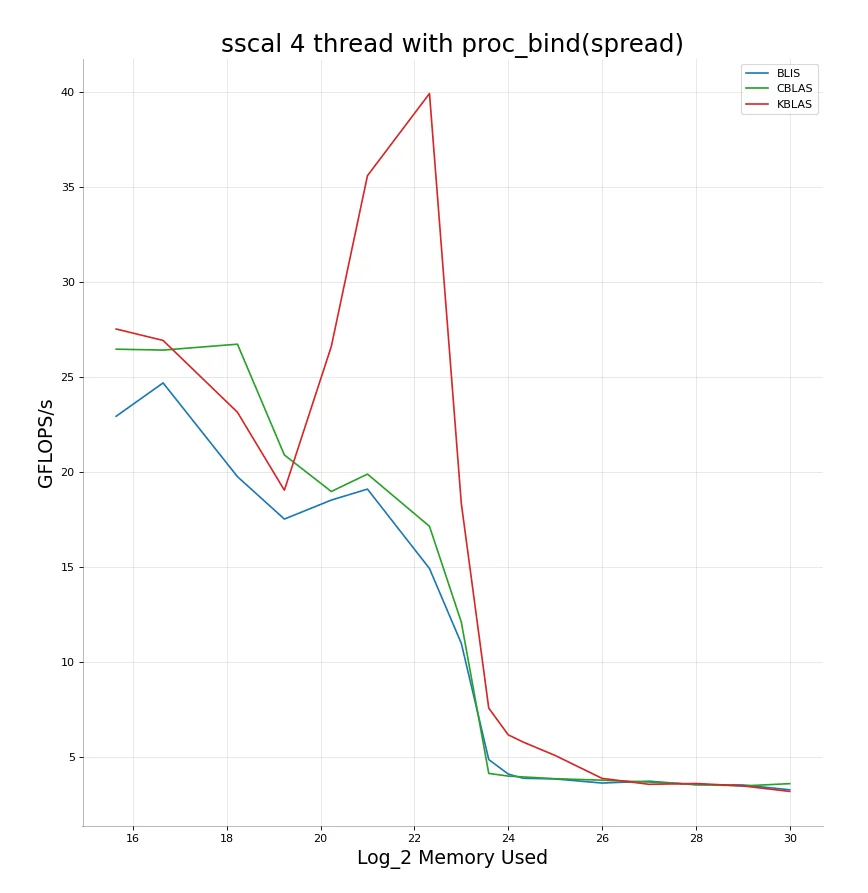
Here is where the OpenMP pragmas which give us more fine tuned control of thread affinity and allocation come in very useful. Using proc_bind(spread) allows us to increase running threads to $4$ while maintaining a low percentage of false sharing. This gives a considerable boost in performance, but as we keep increasing memory the amount of false sharing only keeps increasing between the 4 competing threads.
Notice the higher FLOP/s compared to the 2-thread run.
+----+---------------+------------+
|    |   Memory used |   GFLOPS/s |
|----+---------------+------------|
|  0 |       15.6439 |   27.5244  |
|  1 |       16.6439 |   26.9237  |
|  2 |       18.2288 |   23.145   |
|  3 |       19.2288 |   19.0416  |
|  4 |       20.2288 |   26.6045  |
|  5 |       21      |   35.5922  |
|  6 |       22.3219 |   39.9146  |
|  7 |       23      |   18.351   |
|  8 |       23.585  |    7.57891 |
|  9 |       24      |    6.17116 |
| 10 |       24.3219 |    5.78736 |
| 11 |       25      |    5.08657 |
| 12 |       26      |    3.88079 |
| 13 |       27      |    3.56862 |
| 14 |       28      |    3.61083 |
| 15 |       29      |    3.48344 |
| 16 |       30      |    3.19347 |
+----+---------------+------------+
Can we do something to reduce false sharing when memory being read overflows cache size? The drop comes mainly after we overflow all the cache memory we have.
→ Using non-temporal hints and stores seems like a good idea here. The problem is too many threads competing for limited cache because each thread ends up filling part of the cache with memory it won’t be accessing ever again. Non-temporal store instructions do not work on all types of memory, but they do provide hints that this memory can be evicted from cache and in general do hint that they should be evicted once used whenever possible. Implementing this for large cache sizes turns out to be very successful. This combined with a minor schedule(static, 128) while we are in $L2 \to L3$ territory gives us our final result.
KBLAS - sscal
+----+---------------+------------+
|    |   Memory used |   GFLOPS/s |
|----+---------------+------------|
|  0 |       15.6439 |   26.7844  |
|  1 |       16.6439 |   27.0707  |
|  2 |       18.2288 |   26.3522  |
|  3 |       19.2288 |   22.8382  |
|  4 |       20.2288 |   25.8374  |
|  5 |       21      |   38.0308  |
|  6 |       22.3219 |   44.9139  |
|  7 |       23      |   19.6356  |
|  8 |       23.585  |    8.92693 |
|  9 |       24      |    6.92278 |
| 10 |       24.3219 |    6.07048 |
| 11 |       25      |    5.10881 |
| 12 |       26      |    4.45963 |
| 13 |       27      |    4.44933 |
| 14 |       28      |    4.43135 |
| 15 |       29      |    4.41979 |
| 16 |       30      |    4.36659 |
+----+---------------+------------+
CBLAS - sscal
+----+---------------+------------+
|    |   Memory used |   GFLOPS/s |
|----+---------------+------------|
|  0 |       15.6439 |   26.1373  |
|  1 |       16.6439 |   27.3349  |
|  2 |       18.2288 |   26.1963  |
|  3 |       19.2288 |   22.5089  |
|  4 |       20.2288 |   19.7618  |
|  5 |       21      |   19.1649  |
|  6 |       22.3219 |   19.6915  |
|  7 |       23      |   12.4671  |
|  8 |       23.585  |    4.63941 |
|  9 |       24      |    4.13325 |
| 10 |       24.3219 |    3.92989 |
| 11 |       25      |    3.81249 |
| 12 |       26      |    3.56251 |
| 13 |       27      |    3.75595 |
| 14 |       28      |    3.72533 |
| 15 |       29      |    3.65334 |
| 16 |       30      |    3.48209 |
+----+---------------+------------+
BLIS - sscal
+----+---------------+------------+
|    |   Memory used |   GFLOPS/s |
|----+---------------+------------|
|  0 |       15.6439 |   22.8759  |
|  1 |       16.6439 |   25.4255  |
|  2 |       18.2288 |   24.7427  |
|  3 |       19.2288 |   21.9082  |
|  4 |       20.2288 |   19.2777  |
|  5 |       21      |   19.2581  |
|  6 |       22.3219 |   17.7078  |
|  7 |       23      |   12.3045  |
|  8 |       23.585  |    4.60922 |
|  9 |       24      |    4.03432 |
| 10 |       24.3219 |    3.91525 |
| 11 |       25      |    3.89575 |
| 12 |       26      |    3.8172  |
| 13 |       27      |    3.72308 |
| 14 |       28      |    3.72022 |
| 15 |       29      |    3.66334 |
| 16 |       30      |    3.37475 |
+----+---------------+------------+
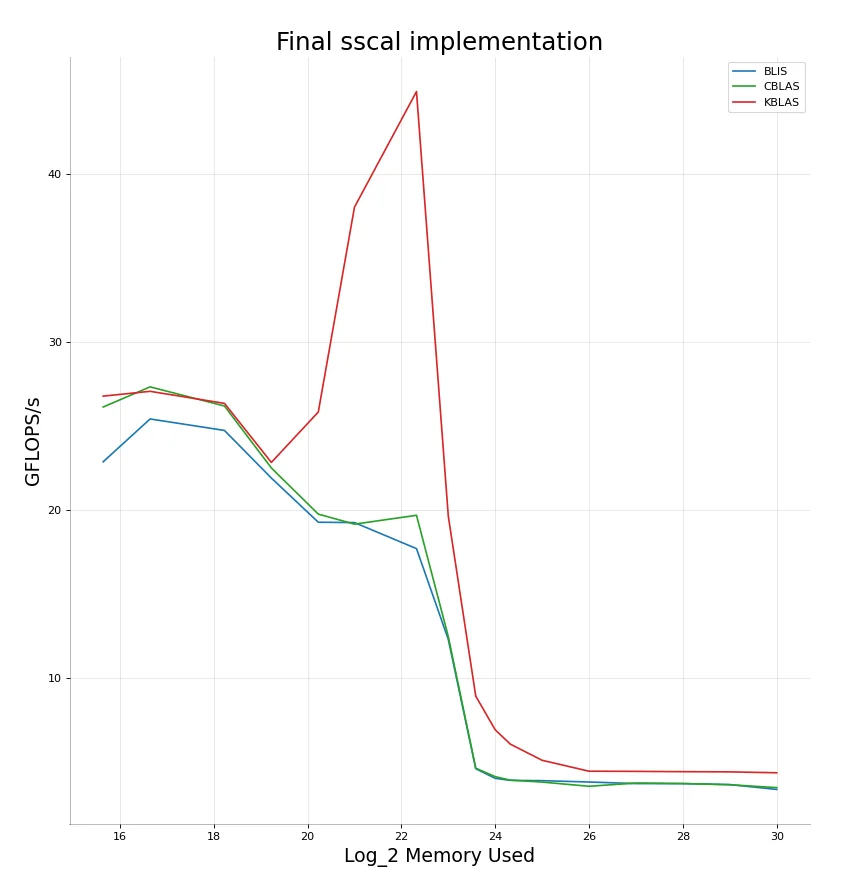
Our sscal implementation pretty much beats BLIS and CBLAS and by quite high margins in practically all workloads. It is never under-performing. Either on par with or much better. The massive gain is seen for vectors ranging in the sizes of $1MB$ to $16MB$. Even after we are done with $L3$ however, we are still able to consistently produce at least $\approx1 GFLOPS/s$ more than BLIS and CBLAS.
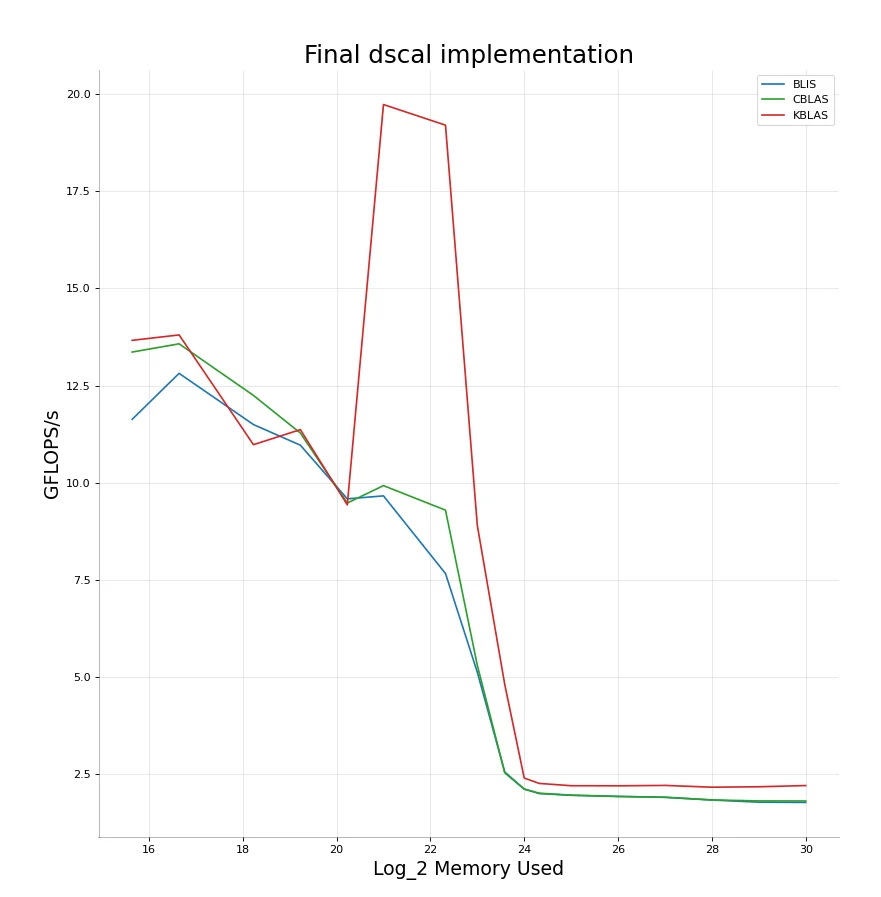
Because our optimizations rely entirely on the memory sizes we’re working with, the code is pretty much the exact same for dscal.
KBLAS - dscal
+----+---------------+------------+
|    |   Memory used |   GFLOPS/s |
|----+---------------+------------|
|  0 |       15.6439 |   13.6625  |
|  1 |       16.6439 |   13.8026  |
|  2 |       18.2288 |   10.9766  |
|  3 |       19.2288 |   11.3643  |
|  4 |       20.2288 |    9.42722 |
|  5 |       21      |   19.7346  |
|  6 |       22.3219 |   19.2039  |
|  7 |       23      |    8.89872 |
|  8 |       23.585  |    4.8018  |
|  9 |       24      |    2.39269 |
| 10 |       24.3219 |    2.25448 |
| 11 |       25      |    2.19517 |
| 12 |       26      |    2.19255 |
| 13 |       27      |    2.20313 |
| 14 |       28      |    2.15703 |
| 15 |       29      |    2.16863 |
| 16 |       30      |    2.19908 |
+----+---------------+------------+
CBLAS - dscal
+----+---------------+------------+
|    |   Memory used |   GFLOPS/s |
|----+---------------+------------|
|  0 |       15.6439 |   13.3615  |
|  1 |       16.6439 |   13.5734  |
|  2 |       18.2288 |   12.2449  |
|  3 |       19.2288 |   11.2757  |
|  4 |       20.2288 |    9.47351 |
|  5 |       21      |    9.92226 |
|  6 |       22.3219 |    9.2906  |
|  7 |       23      |    5.29672 |
|  8 |       23.585  |    2.52696 |
|  9 |       24      |    2.10817 |
| 10 |       24.3219 |    2.00232 |
| 11 |       25      |    1.95269 |
| 12 |       26      |    1.91755 |
| 13 |       27      |    1.89866 |
| 14 |       28      |    1.82919 |
| 15 |       29      |    1.80406 |
| 16 |       30      |    1.80269 |
+----+---------------+------------+
BLIS - dscal
+----+---------------+------------+
|    |   Memory used |   GFLOPS/s |
|----+---------------+------------|
|  0 |       15.6439 |   11.6296  |
|  1 |       16.6439 |   12.8131  |
|  2 |       18.2288 |   11.4942  |
|  3 |       19.2288 |   10.9634  |
|  4 |       20.2288 |    9.58147 |
|  5 |       21      |    9.65832 |
|  6 |       22.3219 |    7.65926 |
|  7 |       23      |    5.11889 |
|  8 |       23.585  |    2.54898 |
|  9 |       24      |    2.10908 |
| 10 |       24.3219 |    1.99358 |
| 11 |       25      |    1.94815 |
| 12 |       26      |    1.92111 |
| 13 |       27      |    1.89673 |
| 14 |       28      |    1.82711 |
| 15 |       29      |    1.77158 |
| 16 |       30      |    1.76492 |
+----+---------------+------------+
Relevant code for scal can be found here:
sscal
dscal
sdot & ddot
All the memory based parameter tuning we did applies to every benchmark, not just sscal and dscal. What’s now left is simply figuring out the best set of instructions to compute sdot or ddot. There are a few possible ideas we can consider.
- Load + FMA:
haddis a slow instruction, keeping an accumulator we can do FMA with might be useful. - Load + Regular multiply + add: Not sure if FMA is necessary / worth it. Should experiment with regular multiply + add as well.
- Load + DPPS: Could be a possibility to explore, although on zen3 according to Agner Fog’s tables this instruction is slower + limiting as we can only work with 128 bits now. This is especially limiting when working with double precision numbers and hence not scalable enough for consideration.
Data races
Another challenge we come across here is the possibility of dealing with data races when parallelizing this operation over multiple threads. Each thread has to update the sum of the result variable. This is problematic as this write is not atomic and can lead to us having wildly incorrect results. One idea is to simply add a #pragma reduction (+:result) condition in our loop. This makes the write atomic. However, this means I have to update the sum each iteration of the loop which might have considerable overhead, especially since the writes must be atomic.
The alternative solution I have in mind is to allow each thread to privately keep accumulating its copy of the variable during its run. Finally, when the thread is done with its execution we add the value of the thread local accumulated variable to shared result variable. Doing this with OpenMP is not very straightforward however. This is what we are required to do:
#pragma omp parallel reduction(+:result) num_threads(...
{
		#pragma omp for nowait
}
What this does is tell OpenMP to parallelize code within that block. Now adding a #pragma omp for inside this block causes the for loop to tell the parent parallel block that it requires a thread group and then parallelizes it over a set of threads. The private/shared/reduction rules imposed by the parent apply to these worker threads as well. Now, I can create local variables inside this block which the loop sums over. Once this is done, we can use the reduction rule to add these partial accumulated sums to the global result variable. The nowait clause simply instructs the OpenMP thread to not wait for the rest of the for threads to finish before continuing execution. This is fine as the computation following the for loop is not dependent on anything that is being computed by any of the other threads in the group or vice versa.
Implementing all of this gives us our final performance results:
KBLAS - sdot
+----+---------------+------------+
|    |   Memory used |   GFLOPS/s |
|----+---------------+------------|
|  0 |       15.6439 |    32.4182 |
|  1 |       16.6439 |    33.4257 |
|  2 |       18.2288 |    33.7023 |
|  3 |       19.2288 |    25.3582 |
|  4 |       20.2288 |    22.8789 |
|  5 |       21      |    64.2133 |
|  6 |       22.3219 |    62.8844 |
|  7 |       23      |    78.8638 |
|  8 |       23.585  |    53.4039 |
|  9 |       24      |    49.8571 |
| 10 |       24.3219 |    33.9986 |
| 11 |       25      |    16.6836 |
| 12 |       26      |    13.309  |
| 13 |       27      |    11.0947 |
| 14 |       28      |    11.1318 |
| 15 |       29      |    11.2067 |
| 16 |       30      |    11.0233 |
+----+---------------+------------+
CBLAS - sdot
+----+---------------+------------+
|    |   Memory used |   GFLOPS/s |
|----+---------------+------------|
|  0 |       15.6439 |   30.5628  |
|  1 |       16.6439 |   32.1508  |
|  2 |       18.2288 |   32.8369  |
|  3 |       19.2288 |   29.2845  |
|  4 |       20.2288 |   23.0307  |
|  5 |       21      |   26.1548  |
|  6 |       22.3219 |   26.7091  |
|  7 |       23      |   24.1143  |
|  8 |       23.585  |   21.4597  |
|  9 |       24      |   17.921   |
| 10 |       24.3219 |   15.7512  |
| 11 |       25      |   12.1024  |
| 12 |       26      |    9.4867  |
| 13 |       27      |    8.50288 |
| 14 |       28      |    8.36098 |
| 15 |       29      |    9.42331 |
| 16 |       30      |    8.35616 |
+----+---------------+------------+
BLIS - sdot
+----+---------------+------------+
|    |   Memory used |   GFLOPS/s |
|----+---------------+------------|
|  0 |       15.6439 |   27.5369  |
|  1 |       16.6439 |   30.5812  |
|  2 |       18.2288 |   31.9513  |
|  3 |       19.2288 |   28.1317  |
|  4 |       20.2288 |   22.9166  |
|  5 |       21      |   26.6008  |
|  6 |       22.3219 |   20.0403  |
|  7 |       23      |   22.6566  |
|  8 |       23.585  |   23.7281  |
|  9 |       24      |   16.7784  |
| 10 |       24.3219 |   15.6218  |
| 11 |       25      |   12.6145  |
| 12 |       26      |    9.31534 |
| 13 |       27      |    8.63364 |
| 14 |       28      |    8.49679 |
| 15 |       29      |    9.32126 |
| 16 |       30      |    8.37292 |
+----+---------------+------------+
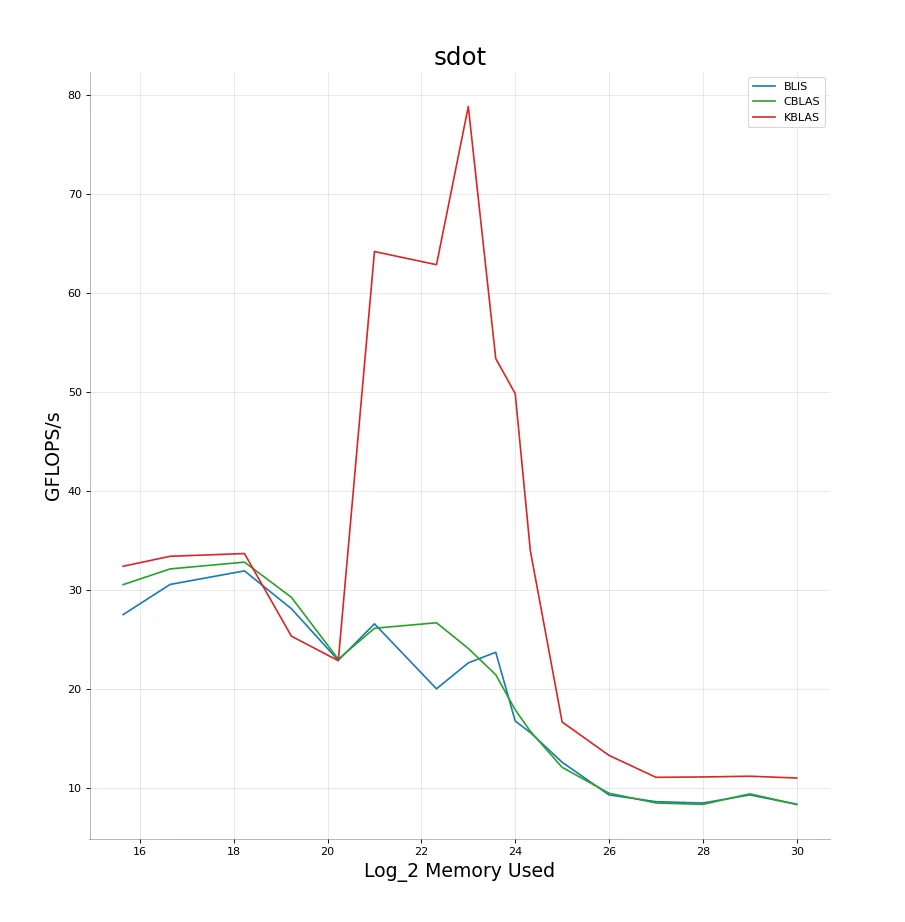
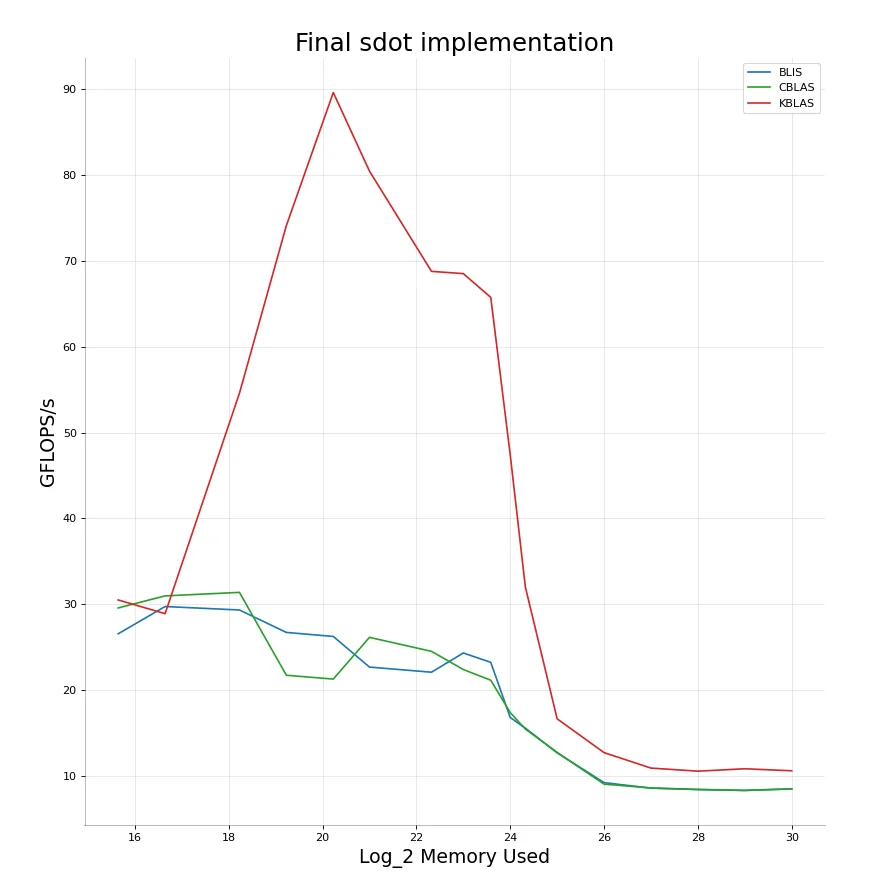
No write-backs
Something I noticed then is the very high FLOPS/s I got on dot compared to scal. An obvious reason for this is that in dot, I don’t have to perform any write-backs to memory. Does this mean the amount of false sharing I have to compete against reduces by a good amount? I decided to run the benchmark again but this time letting myself access more cores and threads than previously. This turns out to be an excellent idea and I get the following results. Amazing performance boost. With this we are able to clearly beat BLIS and CBLAS in both small and large data sizes and give almost $5\times$ the performance in the medium ranges $\approx1-16MB$.
KBLAS - sdot
+----+---------------+------------+
|    |   Memory used |   GFLOPS/s |
|----+---------------+------------|
|  0 |       15.6439 |    30.4949 |
|  1 |       16.6439 |    28.8954 |
|  2 |       18.2288 |    54.5931 |
|  3 |       19.2288 |    74.1311 |
|  4 |       20.2288 |    89.6297 |
|  5 |       21      |    80.4699 |
|  6 |       22.3219 |    68.7903 |
|  7 |       23      |    68.5272 |
|  8 |       23.585  |    65.7599 |
|  9 |       24      |    47.4145 |
| 10 |       24.3219 |    32.0242 |
| 11 |       25      |    16.6444 |
| 12 |       26      |    12.7048 |
| 13 |       27      |    10.9017 |
| 14 |       28      |    10.5428 |
| 15 |       29      |    10.823  |
| 16 |       30      |    10.5882 |
+----+---------------+------------+
CBLAS - sdot
+----+---------------+------------+
|    |   Memory used |   GFLOPS/s |
|----+---------------+------------|
|  0 |       15.6439 |   29.5658  |
|  1 |       16.6439 |   30.9696  |
|  2 |       18.2288 |   31.3796  |
|  3 |       19.2288 |   21.7191  |
|  4 |       20.2288 |   21.2733  |
|  5 |       21      |   26.1364  |
|  6 |       22.3219 |   24.5054  |
|  7 |       23      |   22.3898  |
|  8 |       23.585  |   21.1398  |
|  9 |       24      |   17.3707  |
| 10 |       24.3219 |   15.4571  |
| 11 |       25      |   12.7241  |
| 12 |       26      |    9.03112 |
| 13 |       27      |    8.587   |
| 14 |       28      |    8.41701 |
| 15 |       29      |    8.29715 |
| 16 |       30      |    8.47759 |
+----+---------------+------------+
BLIS - sdot
+----+---------------+------------+
|    |   Memory used |   GFLOPS/s |
|----+---------------+------------|
|  0 |       15.6439 |   26.5525  |
|  1 |       16.6439 |   29.7291  |
|  2 |       18.2288 |   29.3259  |
|  3 |       19.2288 |   26.7111  |
|  4 |       20.2288 |   26.242   |
|  5 |       21      |   22.6719  |
|  6 |       22.3219 |   22.0736  |
|  7 |       23      |   24.3165  |
|  8 |       23.585  |   23.2249  |
|  9 |       24      |   16.7992  |
| 10 |       24.3219 |   15.5576  |
| 11 |       25      |   12.6779  |
| 12 |       26      |    9.20955 |
| 13 |       27      |    8.56137 |
| 14 |       28      |    8.3971  |
| 15 |       29      |    8.29895 |
| 16 |       30      |    8.48299 |
+----+---------------+------------+
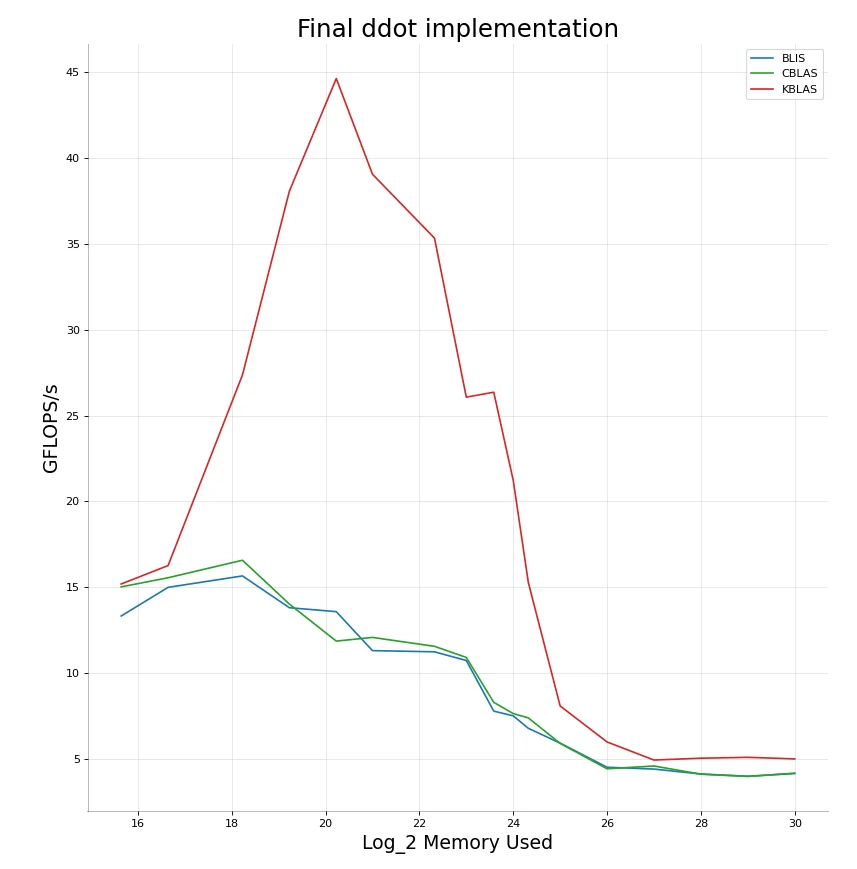
The implementation for ddot is not very different. We just have to modify the horizontal add instructions a little bit. This isn’t really ever going to be a hot-spot in our code so I’ve just gone with a simple readable but not ultra-efficient implementation for both float/double versions.
KBLAS - ddot
+----+---------------+------------+
|    |   Memory used |   GFLOPS/s |
|----+---------------+------------|
|  0 |       15.6439 |   15.1987  |
|  1 |       16.6439 |   16.2712  |
|  2 |       18.2288 |   27.3627  |
|  3 |       19.2288 |   38.0566  |
|  4 |       20.2288 |   44.6123  |
|  5 |       21      |   39.0425  |
|  6 |       22.3219 |   35.3251  |
|  7 |       23      |   26.071   |
|  8 |       23.585  |   26.3589  |
|  9 |       24      |   21.2313  |
| 10 |       24.3219 |   15.2867  |
| 11 |       25      |    8.10269 |
| 12 |       26      |    6.00609 |
| 13 |       27      |    4.95448 |
| 14 |       28      |    5.06161 |
| 15 |       29      |    5.11223 |
| 16 |       30      |    5.02176 |
+----+---------------+------------+
CBLAS - ddot
+----+---------------+------------+
|    |   Memory used |   GFLOPS/s |
|----+---------------+------------|
|  0 |       15.6439 |   15.0312  |
|  1 |       16.6439 |   15.5627  |
|  2 |       18.2288 |   16.5811  |
|  3 |       19.2288 |   14.0308  |
|  4 |       20.2288 |   11.8751  |
|  5 |       21      |   12.0909  |
|  6 |       22.3219 |   11.5726  |
|  7 |       23      |   10.9247  |
|  8 |       23.585  |    8.31322 |
|  9 |       24      |    7.65811 |
| 10 |       24.3219 |    7.40659 |
| 11 |       25      |    5.92358 |
| 12 |       26      |    4.44579 |
| 13 |       27      |    4.608   |
| 14 |       28      |    4.13111 |
| 15 |       29      |    4.00058 |
| 16 |       30      |    4.1858  |
+----+---------------+------------+
BLIS - ddot
+----+---------------+------------+
|    |   Memory used |   GFLOPS/s |
|----+---------------+------------|
|  0 |       15.6439 |   13.3349  |
|  1 |       16.6439 |   15.0041  |
|  2 |       18.2288 |   15.6681  |
|  3 |       19.2288 |   13.8185  |
|  4 |       20.2288 |   13.5891  |
|  5 |       21      |   11.3213  |
|  6 |       22.3219 |   11.2515  |
|  7 |       23      |   10.7465  |
|  8 |       23.585  |    7.80139 |
|  9 |       24      |    7.52648 |
| 10 |       24.3219 |    6.80121 |
| 11 |       25      |    5.93768 |
| 12 |       26      |    4.5354  |
| 13 |       27      |    4.42863 |
| 14 |       28      |    4.14201 |
| 15 |       29      |    4.01051 |
| 16 |       30      |    4.17515 |
+----+---------------+------------+
Relevant code for dot can be found here:
sdot
ddot
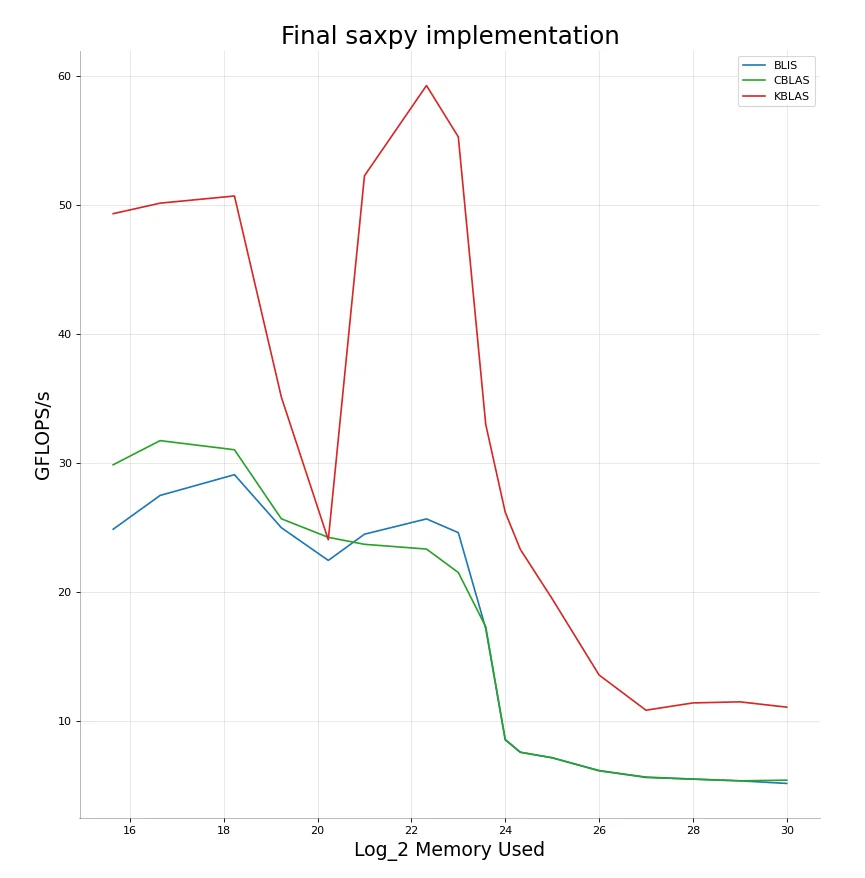
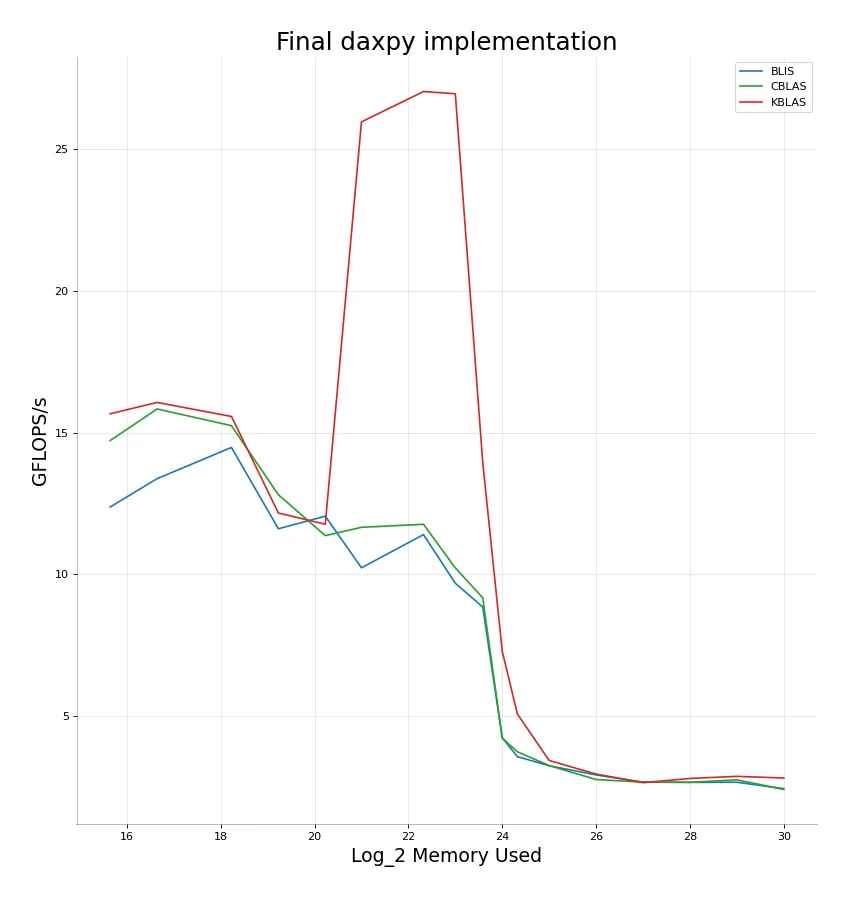
saxpy & daxpy
The axpy functions are sort of like a mix of dot and scal. We’ll need to handle working with 2 vectors like in dot and we’ll need to handle write-backs like we did in scal. The learnings we had while implementing those two functions alone ought to be enough information to implement this. Also, just like in dot, we can use FMA instructions to gain speedup on the FLOPS side as well, although our program will ultimately end up memory bound more than anything.
FMA turns out to be really beneficial here and gives us a noticeable increase in performance compared to say something like scal. Something else I noticed here is that BLIS also performs reasonably well here, much better than CBLAS and even close to the performance of KBLAS and beating it at times. FMA is helpful enough that switching to 2 threads just when crossing the $L2$ boundary ends up being a deficit in comparison to scal. Multiple threads however again ends up being beneficial as we keep increasing data. The final results are here:
KBLAS - saxpy
+----+---------------+------------+
|    |   Memory used |   GFLOPS/s |
|----+---------------+------------|
|  0 |       15.6439 |    49.3417 |
|  1 |       16.6439 |    50.1562 |
|  2 |       18.2288 |    50.7136 |
|  3 |       19.2288 |    35.1016 |
|  4 |       20.2288 |    24.0396 |
|  5 |       21      |    52.2806 |
|  6 |       22.3219 |    59.2832 |
|  7 |       23      |    55.3022 |
|  8 |       23.585  |    32.9809 |
|  9 |       24      |    26.1802 |
| 10 |       24.3219 |    23.2948 |
| 11 |       25      |    19.4666 |
| 12 |       26      |    13.5502 |
| 13 |       27      |    10.8165 |
| 14 |       28      |    11.3821 |
| 15 |       29      |    11.4666 |
| 16 |       30      |    11.0536 |
+----+---------------+------------+
CBLAS - saxpy
+----+---------------+------------+
|    |   Memory used |   GFLOPS/s |
|----+---------------+------------|
|  0 |       15.6439 |   29.8596  |
|  1 |       16.6439 |   31.7331  |
|  2 |       18.2288 |   31.0241  |
|  3 |       19.2288 |   25.6688  |
|  4 |       20.2288 |   24.2299  |
|  5 |       21      |   23.6875  |
|  6 |       22.3219 |   23.3208  |
|  7 |       23      |   21.5013  |
|  8 |       23.585  |   17.2897  |
|  9 |       24      |    8.55303 |
| 10 |       24.3219 |    7.55571 |
| 11 |       25      |    7.12983 |
| 12 |       26      |    6.1104  |
| 13 |       27      |    5.63097 |
| 14 |       28      |    5.46632 |
| 15 |       29      |    5.33872 |
| 16 |       30      |    5.38933 |
+----+---------------+------------+
BLIS - saxpy
+----+---------------+------------+
|    |   Memory used |   GFLOPS/s |
|----+---------------+------------|
|  0 |       15.6439 |   24.8586  |
|  1 |       16.6439 |   27.4797  |
|  2 |       18.2288 |   29.0903  |
|  3 |       19.2288 |   24.9761  |
|  4 |       20.2288 |   22.4395  |
|  5 |       21      |   24.4729  |
|  6 |       22.3219 |   25.6598  |
|  7 |       23      |   24.5933  |
|  8 |       23.585  |   17.1534  |
|  9 |       24      |    8.51503 |
| 10 |       24.3219 |    7.55425 |
| 11 |       25      |    7.1247  |
| 12 |       26      |    6.13848 |
| 13 |       27      |    5.59954 |
| 14 |       28      |    5.47486 |
| 15 |       29      |    5.33735 |
| 16 |       30      |    5.13565 |
+----+---------------+------------+
Pretty much same implementation for daxpy.
KBLAS - daxpy
+----+---------------+------------+
|    |   Memory used |   GFLOPS/s |
|----+---------------+------------|
|  0 |       15.6439 |   15.6674  |
|  1 |       16.6439 |   16.0682  |
|  2 |       18.2288 |   15.5728  |
|  3 |       19.2288 |   12.1665  |
|  4 |       20.2288 |   11.7703  |
|  5 |       21      |   25.9659  |
|  6 |       22.3219 |   27.036   |
|  7 |       23      |   26.9574  |
|  8 |       23.585  |   13.9522  |
|  9 |       24      |    7.29532 |
| 10 |       24.3219 |    5.08099 |
| 11 |       25      |    3.43613 |
| 12 |       26      |    2.95682 |
| 13 |       27      |    2.65331 |
| 14 |       28      |    2.80176 |
| 15 |       29      |    2.8763  |
| 16 |       30      |    2.81742 |
+----+---------------+------------+
CBLAS - daxpy
+----+---------------+------------+
|    |   Memory used |   GFLOPS/s |
|----+---------------+------------|
|  0 |       15.6439 |   14.7215  |
|  1 |       16.6439 |   15.8373  |
|  2 |       18.2288 |   15.248   |
|  3 |       19.2288 |   12.8118  |
|  4 |       20.2288 |   11.3691  |
|  5 |       21      |   11.6618  |
|  6 |       22.3219 |   11.7689  |
|  7 |       23      |   10.2316  |
|  8 |       23.585  |    9.17419 |
|  9 |       24      |    4.22879 |
| 10 |       24.3219 |    3.74399 |
| 11 |       25      |    3.25647 |
| 12 |       26      |    2.76513 |
| 13 |       27      |    2.67007 |
| 14 |       28      |    2.66673 |
| 15 |       29      |    2.75282 |
| 16 |       30      |    2.41476 |
+----+---------------+------------+
BLIS - daxpy
+----+---------------+------------+
|    |   Memory used |   GFLOPS/s |
|----+---------------+------------|
|  0 |       15.6439 |   12.379   |
|  1 |       16.6439 |   13.378   |
|  2 |       18.2288 |   14.4791  |
|  3 |       19.2288 |   11.6106  |
|  4 |       20.2288 |   12.0553  |
|  5 |       21      |   10.2339  |
|  6 |       22.3219 |   11.4045  |
|  7 |       23      |    9.68807 |
|  8 |       23.585  |    8.84999 |
|  9 |       24      |    4.24071 |
| 10 |       24.3219 |    3.57199 |
| 11 |       25      |    3.2515  |
| 12 |       26      |    2.92566 |
| 13 |       27      |    2.67459 |
| 14 |       28      |    2.66347 |
| 15 |       29      |    2.66854 |
| 16 |       30      |    2.44301 |
+----+---------------+------------+
We’re pretty much able to beat BLIS and CBLAS in all of the level 1 functions we implemented. Pretty satisfactory results.
BLAS Level 2
kblas_sgemv
Generalized matrix vector multiply. Given a $m\times n$ matrix $M$ and a $n \times 1$ vector $V$ it computes the product vector $A = Mv$. The final dimensions of $A$ are $m \times 1$. There are 2 main cases we need to consider here
- Let’s say the matrix is stored in ROW order and we are computing $Mv$. The memory is stored contiguously and all our matrix reads will be prefetched by the pre-fetcher. The vector access pattern is also relatively simple to predict. This means we can just do normal reads and do the multiplication like we normally code matrix vector multiplication.
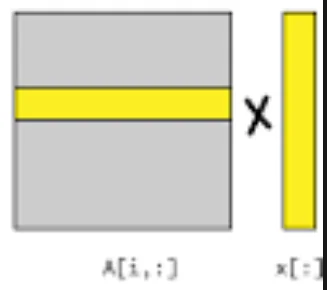
- Consider the case where we have to compute $M^Tv$ or the matrix $M$ is stored in COL order and we have to compute $Mv$. In both these cases our matrix data access pattern looks like the figure on the left. Massive jumps in memory accesses means pre-fetching these addresses is very difficult. We would have to pre-fetch every single time we iterate over the indices in the column and cannot rely on the fetched cache-line to have more than 1 single element. To counter this we can compute the dot product of $v[0]$ with the first row of the matrix. This gives us a partial summation for $A$. Repeatedly computing this summation again means we have race conditions to take care of but this will at least ensure that our data access pattern is cache friendly.
What this means is we want to divide up the matrix vector multiply into 2 cases. 1 where we do normal strided multiplication and one where we account for the large jumps. To account for the leading row where sometimes we’ll have to multiply sub-matrices with vectors we can experiment with adding pre-fetch statements in code to hint the CPU to fetch those lines into cache. This should also hopefully help us reduce the effect of cache misses on our function.
Case #1
I have quite a few ideas I’d like to try out here. After the end of the operation, our final vector $Y$ has the form
$$ Y[i] = \beta \times Y[i] + \alpha \times(A[i][0] \cdot X[0] + A[i][1] \cdot X[1] + \dots + A[i][n-1] \cdot A[n-1]) \\ \implies Y[i] = \beta \times Y[i] + \alpha \times \sum_{j=0}^{n-1}A[i][j]\cdot X[j] $$One idea here is to run our optimized version of scal first to transform $Y \to \beta \times Y$ and then compute the summation following which we can multiply it by $\alpha$ before adding it to $\beta Y[i]$, However, we can’t do this with FMA as we’re only computing one sum at one time. And I highly doubt that it is profitable to store each element in memory before doing the final computation with FMA. This method also requires that I first iterate over all of $Y$ once and then do it again when adding the second term to it. Lack of FMA and this double iteration might prove to be slower. But again, since the computation using $A$ which is a $M \times N$ matrix is the bottleneck, the double $Y$ access might not be a big problem after all.
Another idea I have here is to compute $\alpha \times \sum_{j=k}^{k+8}A[i][j]\cdot X[j]$ first. We can then use FMA to add this sum $s$ to $Y$ like so $Y[i] = \beta \times Y[i] + s$. This allows using FMA and we don’t access $Y$ twice, but this has the penalty that I’ll end up accessing up to 8 rows of $A$ at the same time. That’s not a very nice cache access pattern.
I can’t really reason out anything as to which method might be faster, so the only option left is to code both up, benchmark and let the results speak for themselves.
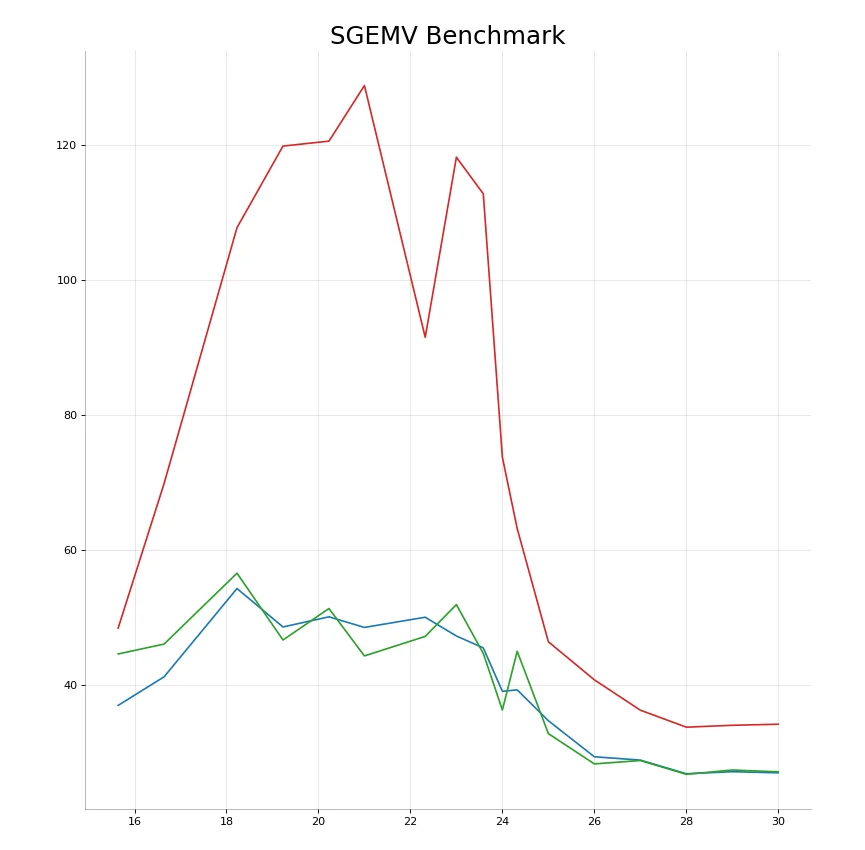
The first idea when implemented gives the following results
KBLAS - sgemv
+----+----------+----------+
|    |   Memory |    Flops |
|----+----------+----------|
|  0 |  15.6437 |  48.404  |
|  1 |  16.6438 |  69.8283 |
|  2 |  18.2287 | 107.688  |
|  3 |  19.2288 | 119.767  |
|  4 |  20.2288 | 120.499  |
|  5 |  20.9997 | 128.732  |
|  6 |  22.3219 |  91.4613 |
|  7 |  22.9997 | 118.113  |
|  8 |  23.5848 | 112.7    |
|  9 |  24      |  73.694  |
| 10 |  24.3222 |  63.1474 |
| 11 |  25.0001 |  46.3859 |
| 12 |  26      |  40.752  |
| 13 |  26.9999 |  36.2615 |
| 14 |  28      |  33.7448 |
| 15 |  28.9999 |  34.0236 |
| 16 |  30      |  34.1832 |
+----+----------+----------+
CBLAS - sgemv
+----+----------+---------+
|    |   Memory |   Flops |
|----+----------+---------|
|  0 |  15.6437 | 44.5799 |
|  1 |  16.6438 | 46.048  |
|  2 |  18.2287 | 56.5389 |
|  3 |  19.2288 | 46.6531 |
|  4 |  20.2288 | 51.3103 |
|  5 |  20.9997 | 44.292  |
|  6 |  22.3219 | 47.1806 |
|  7 |  22.9997 | 51.8916 |
|  8 |  23.5848 | 44.6651 |
|  9 |  24      | 36.2907 |
| 10 |  24.3222 | 44.9791 |
| 11 |  25.0001 | 32.7863 |
| 12 |  26      | 28.3062 |
| 13 |  26.9999 | 28.809  |
| 14 |  28      | 26.7651 |
| 15 |  28.9999 | 27.4012 |
| 16 |  30      | 27.1336 |
+----+----------+---------+
BLIS - sgemv
+----+----------+---------+
|    |   Memory |   Flops |
|----+----------+---------|
|  0 |  15.6437 | 36.9656 |
|  1 |  16.6438 | 41.2038 |
|  2 |  18.2287 | 54.2682 |
|  3 |  19.2288 | 48.5784 |
|  4 |  20.2288 | 50.0798 |
|  5 |  20.9997 | 48.5103 |
|  6 |  22.3219 | 50.0211 |
|  7 |  22.9997 | 47.2412 |
|  8 |  23.5848 | 45.4841 |
|  9 |  24      | 39.0531 |
| 10 |  24.3222 | 39.2671 |
| 11 |  25.0001 | 34.6988 |
| 12 |  26      | 29.3634 |
| 13 |  26.9999 | 28.87   |
| 14 |  28      | 26.8491 |
| 15 |  28.9999 | 27.1517 |
| 16 |  30      | 26.9858 |
+----+----------+---------+
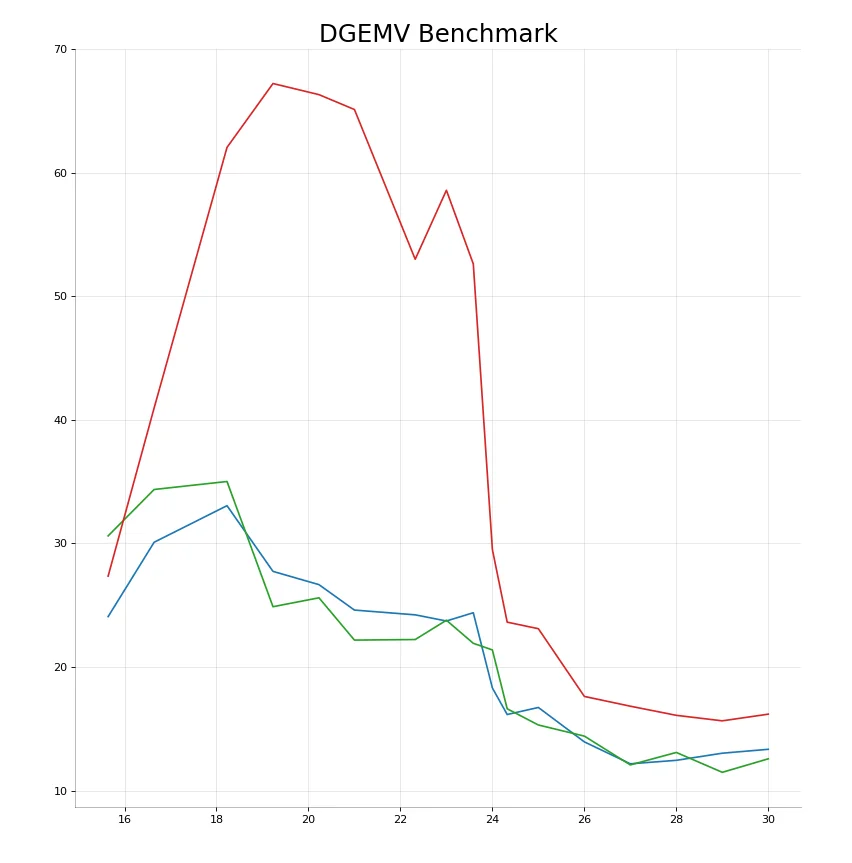
KBLAS - dgemv
+----+----------+---------+
|    |   Memory |   Flops |
|----+----------+---------|
|  0 |  15.6436 | 27.3551 |
|  1 |  16.6437 | 40.9623 |
|  2 |  18.2289 | 62.0474 |
|  3 |  19.2287 | 67.2187 |
|  4 |  20.2288 | 66.3189 |
|  5 |  21      | 65.1162 |
|  6 |  22.3218 | 52.9969 |
|  7 |  23      | 58.5811 |
|  8 |  23.5846 | 52.6212 |
|  9 |  23.9997 | 29.5139 |
| 10 |  24.3218 | 23.6324 |
| 11 |  25      | 23.1014 |
| 12 |  26.0001 | 17.6225 |
| 13 |  27      | 16.8314 |
| 14 |  27.9999 | 16.0933 |
| 15 |  29      | 15.6468 |
| 16 |  29.9999 | 16.1884 |
+----+----------+---------+
CBLAS - dgemv
+----+----------+---------+
|    |   Memory |   Flops |
|----+----------+---------|
|  0 |  15.6436 | 30.6115 |
|  1 |  16.6437 | 34.3677 |
|  2 |  18.2289 | 35.0149 |
|  3 |  19.2287 | 24.8823 |
|  4 |  20.2288 | 25.6034 |
|  5 |  21      | 22.1813 |
|  6 |  22.3218 | 22.2271 |
|  7 |  23      | 23.7892 |
|  8 |  23.5846 | 21.9209 |
|  9 |  23.9997 | 21.3864 |
| 10 |  24.3218 | 16.6219 |
| 11 |  25      | 15.3128 |
| 12 |  26.0001 | 14.4105 |
| 13 |  27      | 12.0814 |
| 14 |  27.9999 | 13.09   |
| 15 |  29      | 11.4815 |
| 16 |  29.9999 | 12.575  |
+----+----------+---------+
BLIS - dgemv
+----+----------+---------+
|    |   Memory |   Flops |
|----+----------+---------|
|  0 |  15.6436 | 24.0806 |
|  1 |  16.6437 | 30.0972 |
|  2 |  18.2289 | 33.0577 |
|  3 |  19.2287 | 27.7414 |
|  4 |  20.2288 | 26.6681 |
|  5 |  21      | 24.6108 |
|  6 |  22.3218 | 24.2242 |
|  7 |  23      | 23.7262 |
|  8 |  23.5846 | 24.394  |
|  9 |  23.9997 | 18.3102 |
| 10 |  24.3218 | 16.1597 |
| 11 |  25      | 16.7286 |
| 12 |  26.0001 | 13.944  |
| 13 |  27      | 12.1705 |
| 14 |  27.9999 | 12.4518 |
| 15 |  29      | 13.0285 |
| 16 |  29.9999 | 13.3451 |
+----+----------+---------+